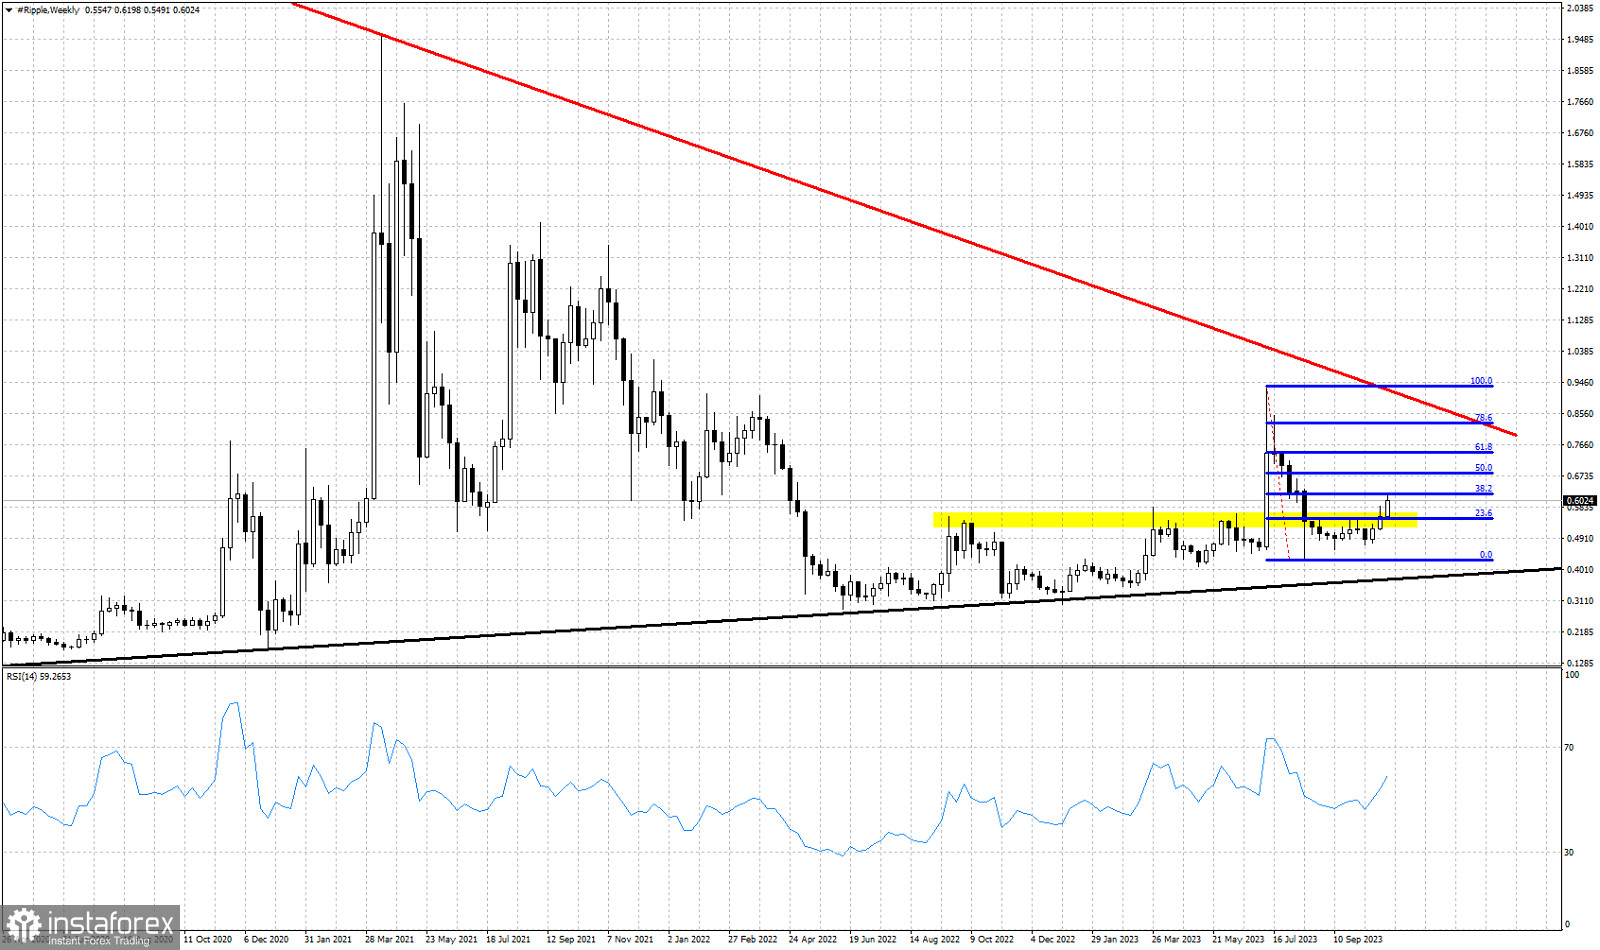
Red line- major resistance trend line
Yellow rectangle- horizontal resistance
Blue lines- Fibonacci retracement levels
Black line- support trend line
XRPUSD is trading around $0.60 making new weekly highs relative to last week. The previous week price closed right on top of the major horizontal resistance and key pivot point at $0.555. This week bulls seem strong enough to push price above the major horizontal resistance. XRPUSD bulls need to close the weekly candle above $0.55 this week At current levels we also find the short-term resistance by the 38% Fibonacci retracement level. Breaking above $0.61 would be an added sign of strength and price could continue its climb towards the next Fibonacci retracement level at $0.68. XRPUSD has so far managed to respect the black support trend line and is now moving higher. As we explained in previous posts, recapturing $0.55 will open the way for a move higher towards $0.73 and why not towards the red downward sloping major trend line resistance. The $0.47 level is now considered a major support level that if broken could push XRP back towards $0.20.


