


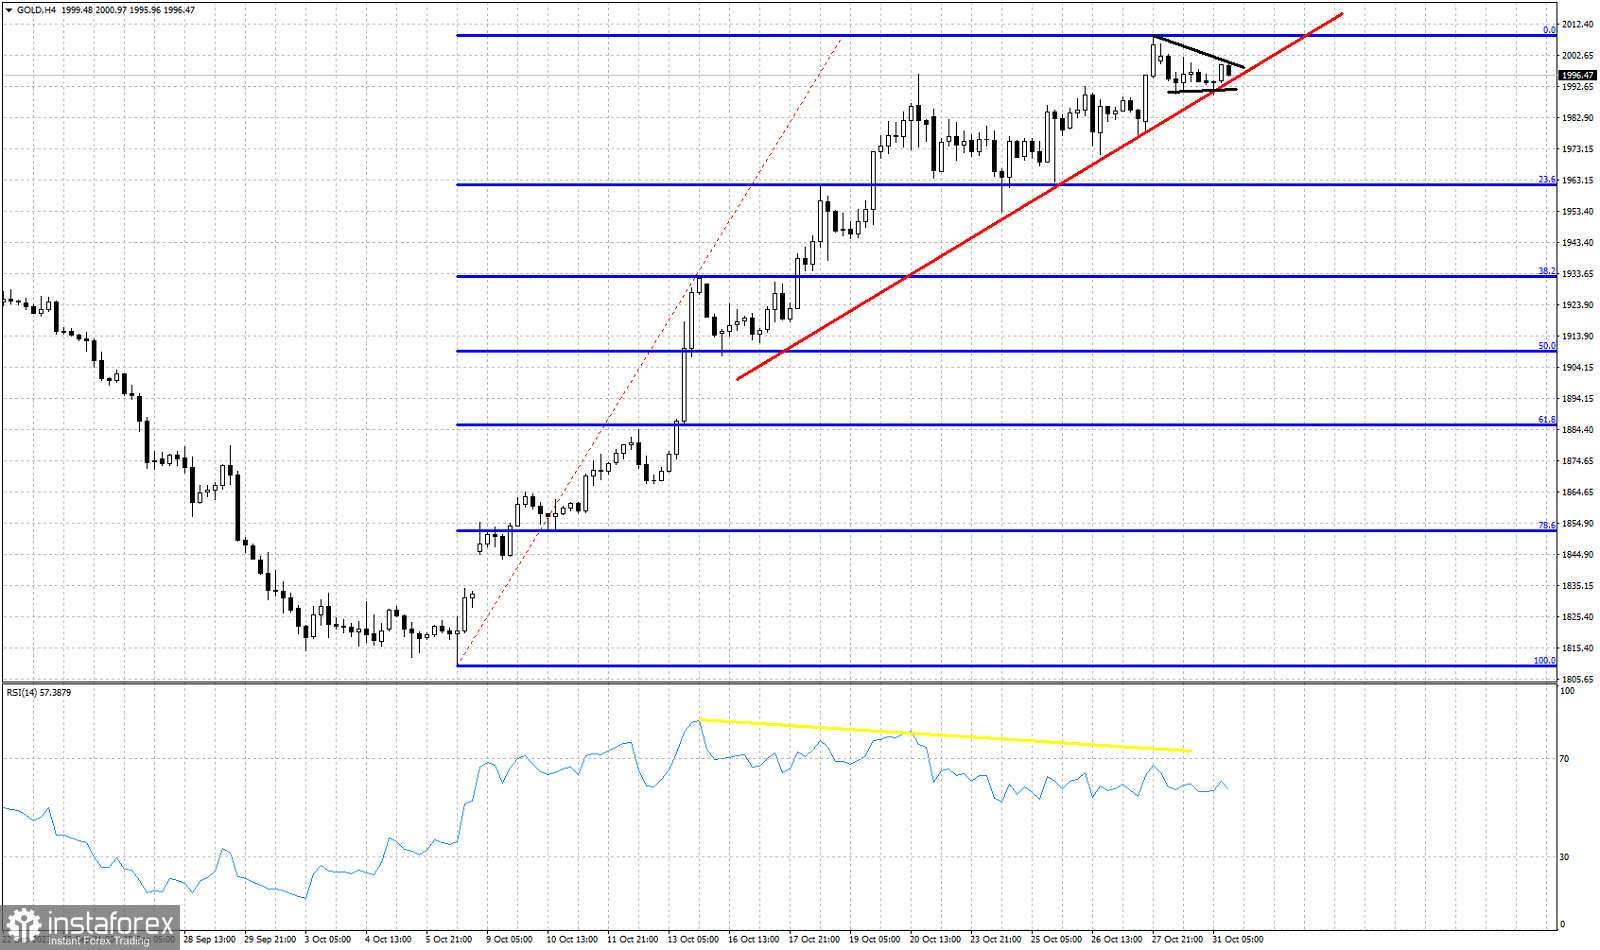
Red line -support trend line
Yellow line- bearish RSI divergence
Black lines- triangle pattern
Blue lines - Fibonacci retracement levels
Gold price continues to trade sideways around $1,995 price level. Price so far continues to respect the red upward sloping support trend line as price is forming a triangle pattern with a base around $1,990 and resistance at today's highs of $2,000. Technically trend remains bullish. As long as the red trend line holds, bulls have hopes of breaking above the major horizontal resistance area around $2,000. Recent low at $1,990 is considered key short-term support. A break below this level will also lead price to make a deep pull back. A break of the triangle to the upside will push Gold price to new higher highs, but with the RSI lagging behind, I believe the upside potential is limited.


