EUR/USD

Higher timeframes
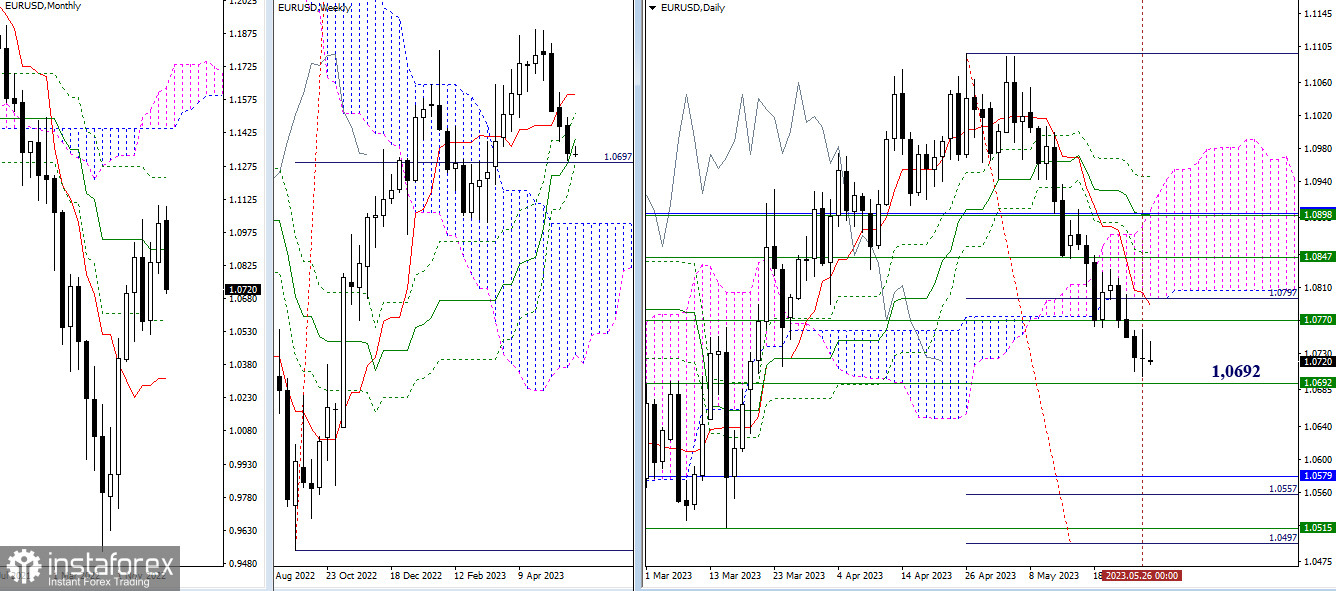
Last week, there was a development of a bearish trend during the day. Consolidation below the Ichimoku cloud led to the formation of a daily downside target (1.0557 - 1.0497). Additionally, a downward correction on the weekly timeframe was observed. As a result, bears aimed to test the strength of the supports of the weekly golden cross and potentially eliminate them. The final level of the cross today is located around 1.0692. If bears fail to realize their plans and the initiative shifts to the opponent's side, the nearest objectives for bulls would be to find support from the weekly medium-term trend (1.0770) and the daily short-term trend (1.0788), as well as to return to the daily cloud (1.0796).

H4 - H1
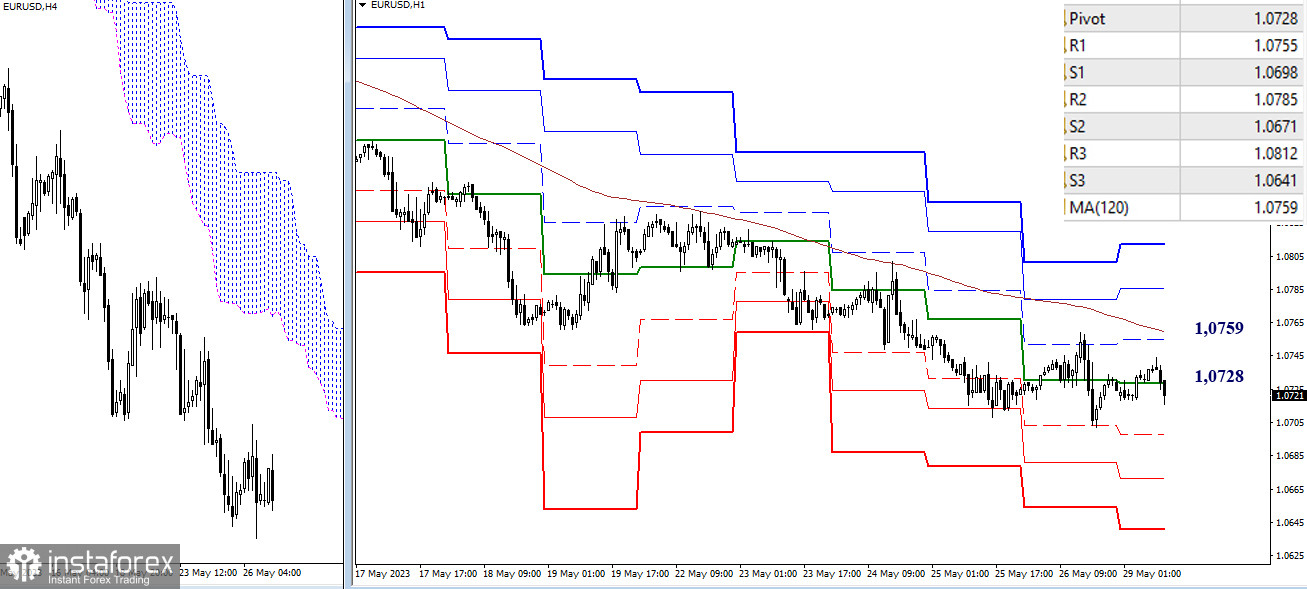
Currently, the bears hold the advantage on the lower timeframes. The pair is trading below key levels at 1.0728 (central pivot point) and 1.0759 (weekly long-term trend). These levels represent the balance of power. If the decline continues within the day, reference points can be marked at 1.0698 - 1.0671 - 1.0641 (classic pivot points). In the event of a breakthrough of key levels (1.0728–59) and consolidation above them, the advantage will shift to bulls, and potential reference points would be 1.0785 - 1.0812 (classic pivot points).
***
GBP/USD

Higher timeframes
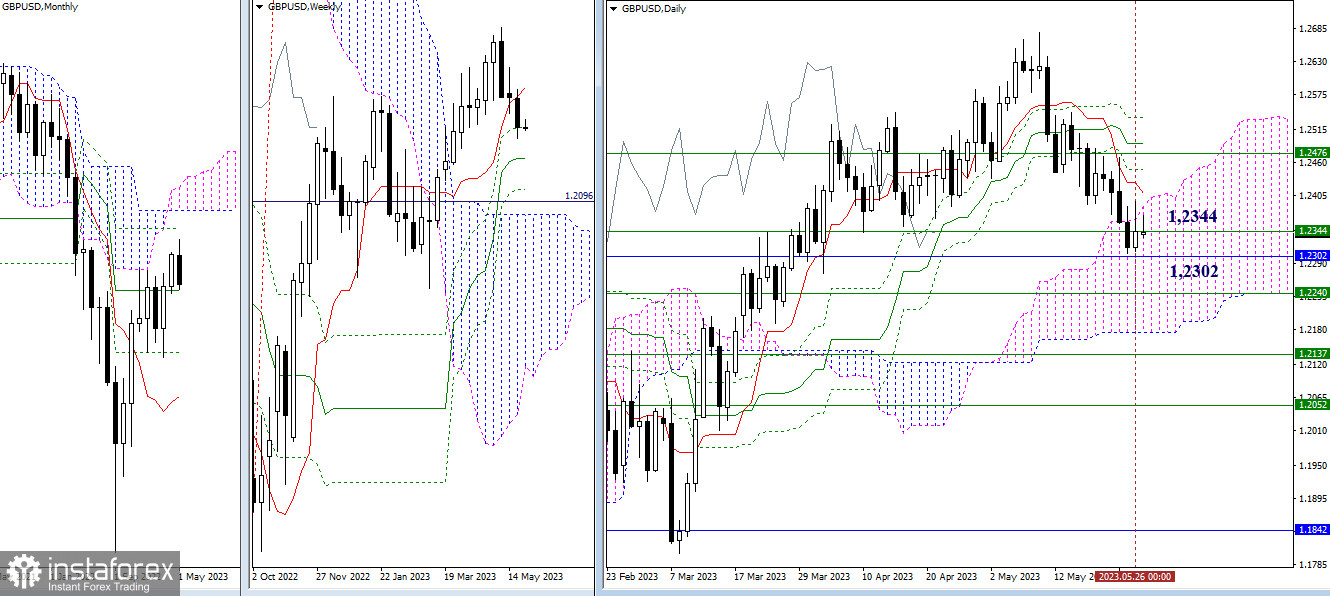
Last week, the pair started testing the monthly medium-term trend (1.2302) and entered the attraction zone of the weekly level (1.2344). As the next bearish reference points, we can note 1.2240 (weekly medium-term trend) and 1.2173 (lower boundary of the daily cloud). If the activity shifts to the bulls' side, the resistances of the daily Ichimoku cross (1.2408 - 1.2449 - 1.2492 - 1.2536) reinforced by the weekly short-term trend (1.2476) could be significant for them.

H4 - H1
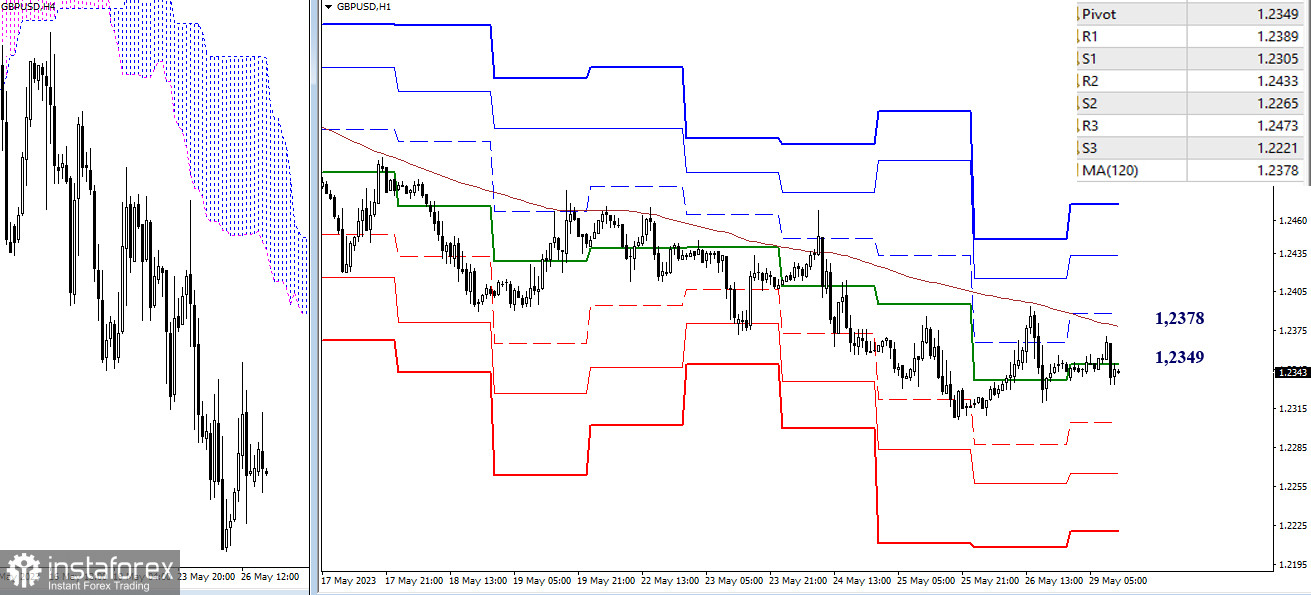
On the lower timeframes, the pair is within a correction zone, but the main advantage is currently on the bears' side. Support levels provided by classic pivot points (1.2305 - 1.2265 - 1.2221) serve as reference points for intraday decline. A breakout and reversal of the weekly long-term trend (1.2378) could change the current balance of power. Resistance levels from classic pivot points (1.2389 - 1.2433 - 1.2473) would become reference points for further upward development.
The technical analysis of the situation uses:
Higher timeframes - Ichimoku Kinko Hyo (9.26.52) + Fibo Kijun levels
Lower timeframes - H1 - Pivot Points (classic) + Moving Average 120 (weekly long-term trend)


