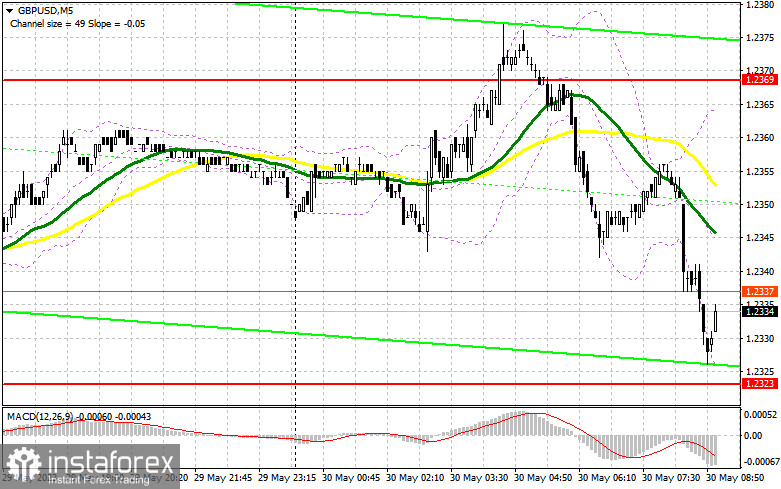
Yesterday, no trading signals came. Let's turn to the M5 chart to get a picture of what happened. Previously, I considered entering the market from 1.2345. A breakout through the mark produced no signal. There was no point in selling because the pair hovered around 1.2345. In the second half of the day, volatility was low and no entry signals were generated.

When to open long positions on GBP/USD:
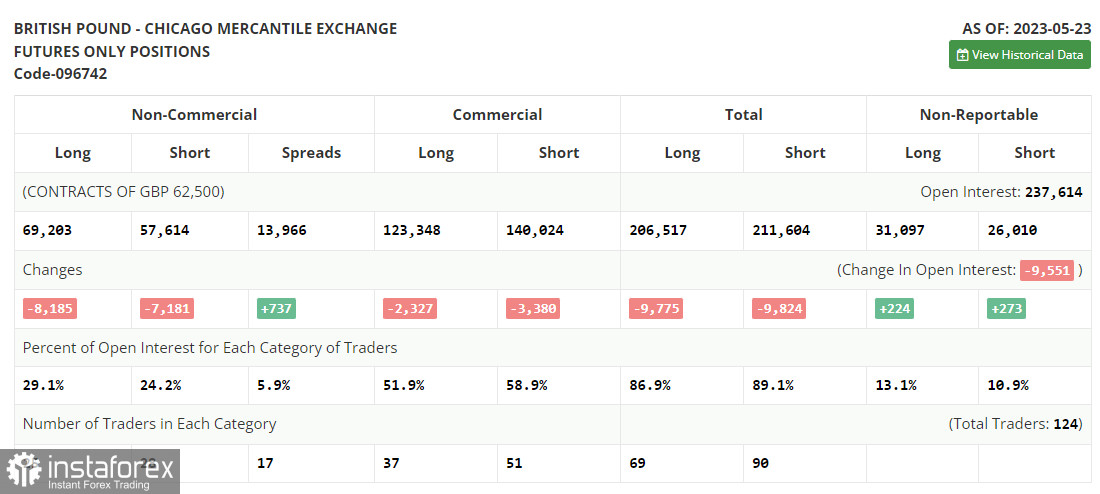
Let's see what has changed in the futures market. According to the COT report for May 23, the number of long and short positions decreased. Last week, the pound was bearish. Fearing a default and a recession in the US, traders had to close positions, especially in the face of uncertainty surrounding the Bank of England's monetary policy stance. The regulator hinted at a pause in rate hikes. However, with high inflationary pressures in the UK, it seems unlikely. The COT report showed that non-commercial short positions dropped by 7,181 to 57,614, and non-commercial long positions fell by 8,185 to 69,203. The overall non-commercial net position came in at 11,059 versus 12,593 a week earlier. The weekly closing price fell to 1.2425 from 1.2495.
No macro releases are scheduled in the UK today. Buyers will have a chance to protect monthly lows and build a bullish correction. Good news on the debt limit agreement from the US House of Representatives may instill optimism in the market and increase demand for risk assets.

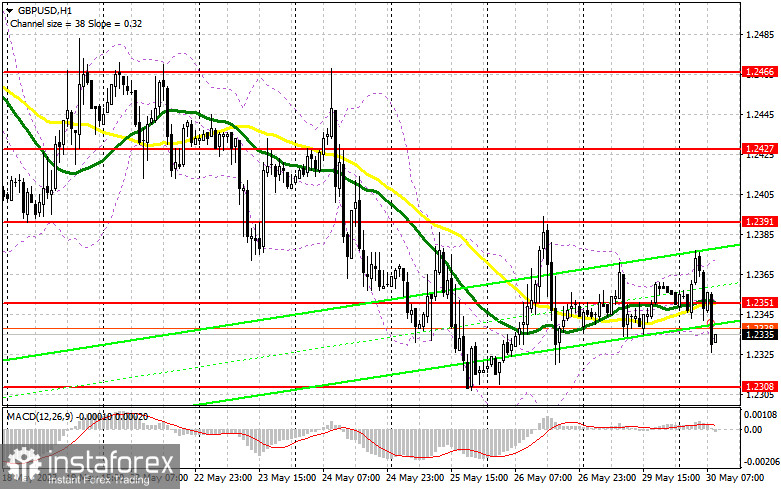
Buying volumes will increase if buyers manage to protect 1.2308 support. A false breakout through the monthly low will create a buy entry signal. The target is seen at 1.2351, which is in line with the bearish moving averages. A breakout and a downside test of this range will produce an additional buy signal, targeting 1.2391. Without this mark, buyers will unlikely be able to push GBP/USD higher. If the pair goes above this range, the target will stand at 1.2427 where I will lock in profit. If GBP/USD falls and there is no bullish activity at 1.2308, the pound will face pressure. Therefore, it would be wiser to buy at 1.2275 after a false breakout only. I will buy GBP/USD on a rebound from 1.2237, allowing a correction of 30-35 pips intraday.
When to open short positions on GBP/USD:
Sellers are in control of the market, which is confirmed by a sell-off at 1.2351. However, with no releases coming, buyers may once again attempt to reach current monthly lows. If the price recovers, a false breakout through 1.2351, which is in line with the moving average, will make a sell signal, targeting 1.2308 support. A breakout and an upside retest of this range will create a sell entry point with the target at 1.2275, and a bear trend will resume. The most distant target stands at 1.2237 where I will lock in profit.

If GBP/USD goes up and there is no bearish activity at 1.2351, a correction will continue and buyers will take the market under control. In such a case, a false breakout through 1.2391 resistance will create a sell entry point. If there is no activity there either, I will sell GBP/USD at 1.2427, allowing a bearish correction of 30-35 pips intraday.
Indicator signals:
Moving averages:
Trading is carried out near the 30-day and 50-day moving averages, which indicates a sideways market.
Note: The period and prices of moving averages are considered by the author on the H1 (1-hour) chart and differ from the general definition of the classic daily moving averages on the daily D1 chart.
Bollinger Bands
Support stands at 1.2320, in line with the lower band. Resistance is seen at 1.2380, in line with the upper band.
Indicator description:
- Moving average (MA) determines the current trend by smoothing volatility and noise. Period 50. Colored yellow on the chart.
- Moving average (MA) determines the current trend by smoothing volatility and noise. Period 30. Colored green on the chart.
- Moving Average Convergence/Divergence (MACD). Fast EMA 12. Slow EMA 26. SMA 9.
- Bollinger Bands. Period 20
- Non-commercial traders are speculators such as individual traders, hedge funds, and large institutions who use the futures market for speculative purposes and meet certain requirements.
- Long non-commercial positions are the total long position of non-commercial traders.
- Non-commercial short positions are the total short position of non-commercial traders.
- Total non-commercial net position is the difference between short and long positions of non-commercial traders.


