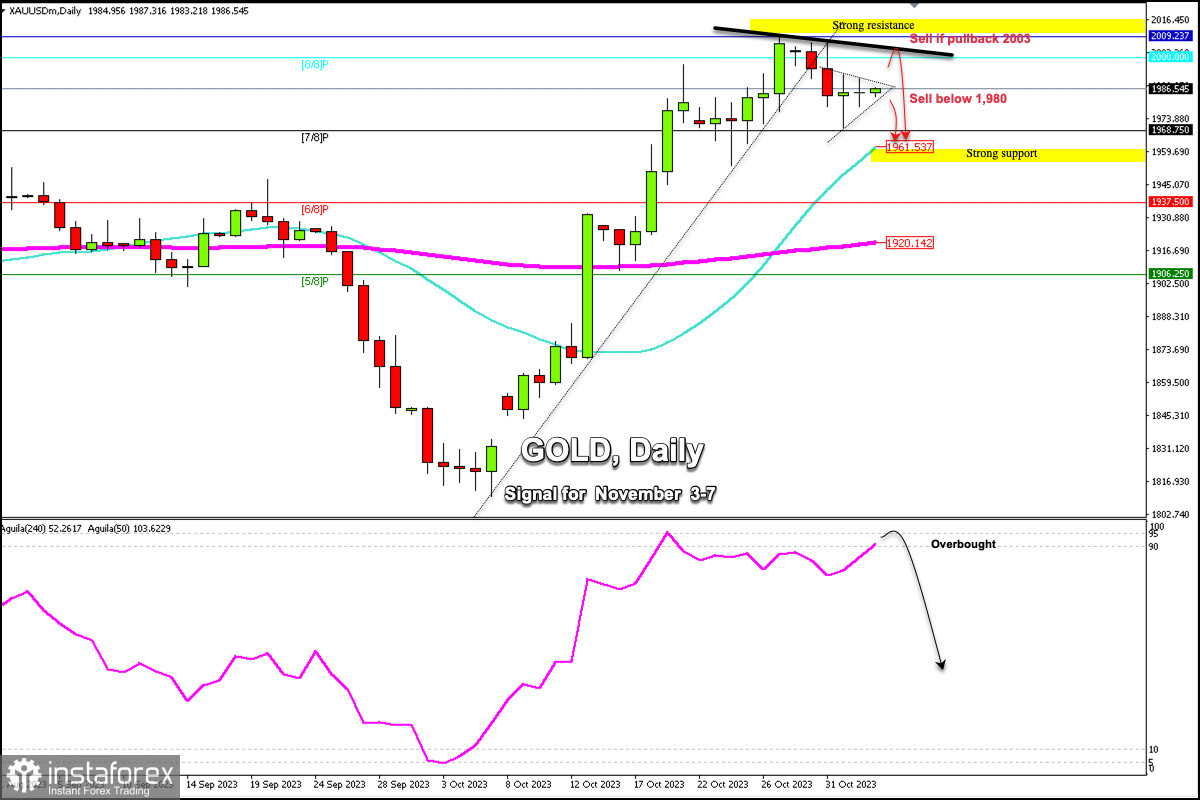
Early in the European session, gold is trading around 1,986.54, below 8/8 Murray ($2,000), and above the 21 SMA and above 7/8 Murray (1,968).
According to the daily chart, we can see that gold broke the uptrend channel formed since October 3rd and is now showing signs of exhaustion. If gold fails to overcome the psychological level of $2,000 and consolidates below 1,995 in the coming days, we could expect a strong technical correction towards the 21 SMA located at 1,961. the instrument could even reach the 200 EMA located at 1,920.
In case gold continues to rise and reaches the 8/8 Murray resistance zone ($2,000) in the next few hours and if it fails to overcome this level, it could be seen as an opportunity to sell with the target at 1,961.
Additionally, if gold falls below 1,980, we could see a bearish acceleration and the price could reach 1,968 and 1,961. Around this area, a symmetrical triangle has formed and the breakout of this triangle could define the trend for the next few days.
Looking at the daily chart, if gold consolidates below the 21 SMA in the next few days, this could mean a change in the trend and the outlook for gold could be negative. Thus, the instrument could reach 1,937 (6/8 Murray) and 1,906 (5/8 Murray) and even reach the psychological level of $1,900.
On the other hand, if gold surpasses its high of 2,009 and consolidates above the psychological level of $2,000, we could expect it to continue rising and the metal could reach +1/8 Murray located at 2,031.
The eagle indicator reached the extreme overbought zone on the daily chart. Therefore, we expect a strong technical correction towards the 21 SMA or towards the 200 EMA in the coming days.


