In the upcoming week, the general sideways movement of the euro is expected to continue. At the beginning of the week, temporary pressure may be on the support zone. The most active phase of the upward movement is likely to occur closer to the weekend. Reversal formation and resumption of the bearish trend can be expected.
EUR/USD
Analysis:
Since October of last year, the quotes of the main euro currency pair have been moving upward in a bullish trend. From a strong potential reversal zone on the daily timeframe since the beginning of February, the price has moved downwards, forming a correction of the last segment of the main wave. The structure of the corrective segment still needs to be completed.
Forecast:
In the upcoming week, the general sideways movement is expected to continue. At the beginning of the week, temporary pressure may be on the support zone. The most active phase of the upward movement is likely to occur closer to the weekend. Reversal formation and resumption of the bearish trend can be expected.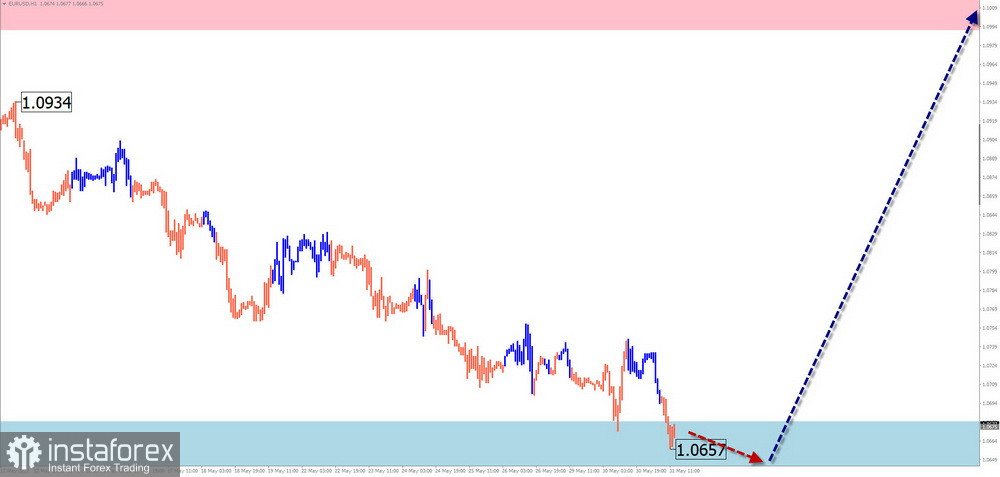
Potential reversal zones:
Resistance:
- 1.0990/1.1040
Support:
- 1.0680/1.0630
Recommendations:
Sales: There will be no conditions for selling the euro next week.
Purchases: It is optimal to wait to complete the current wave and open trades after the appearance of corresponding signals on your trading systems.
USD/JPY
Analysis:
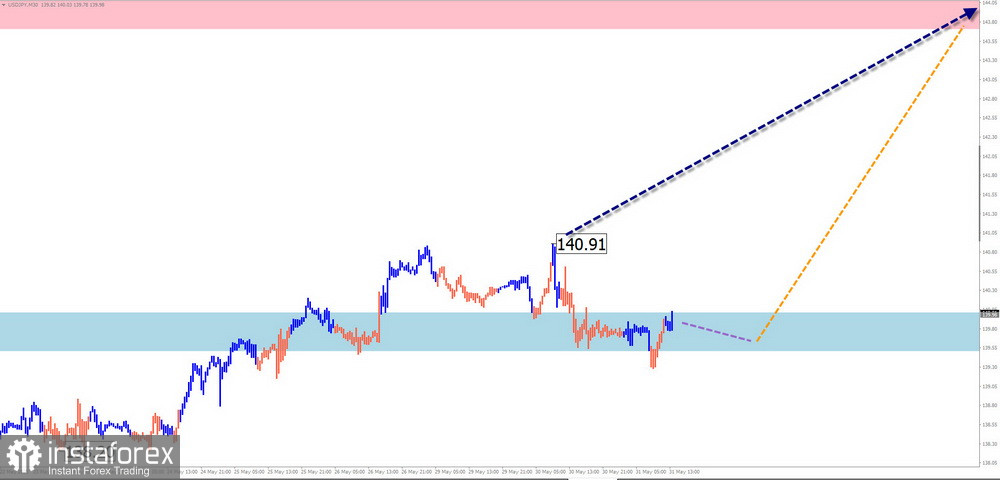
The analysis of the dominant bearish wave of the Japanese Yen's major wave since October of last year shows the formation of the middle part (B). At the time of the analysis, its structure does not indicate completeness. The final segment of the wave is missing. The calculated resistance is located at the lower edge of the preliminary target zone.
Forecast:
In the coming week, the overall upward trend is expected to continue. The beginning of the week may be flat. In the next couple of days, temporary pressure on the price towards the lower boundary of the calculated support cannot be ruled out. Midweek may see activation and a new surge in the pair's course.
Potential reversal zones:
Resistance:
- 143.70/144.20
Support:
- 140.00/139.90
Recommendations:
Purchases: Supporters of purchases may become more active in the upcoming week. The calculated support zone is the optimal entry point for a trade. The potential for upward movement is limited by resistance.
Sales: They are quite risky and have low potential.
GBP/JPY
Analysis:
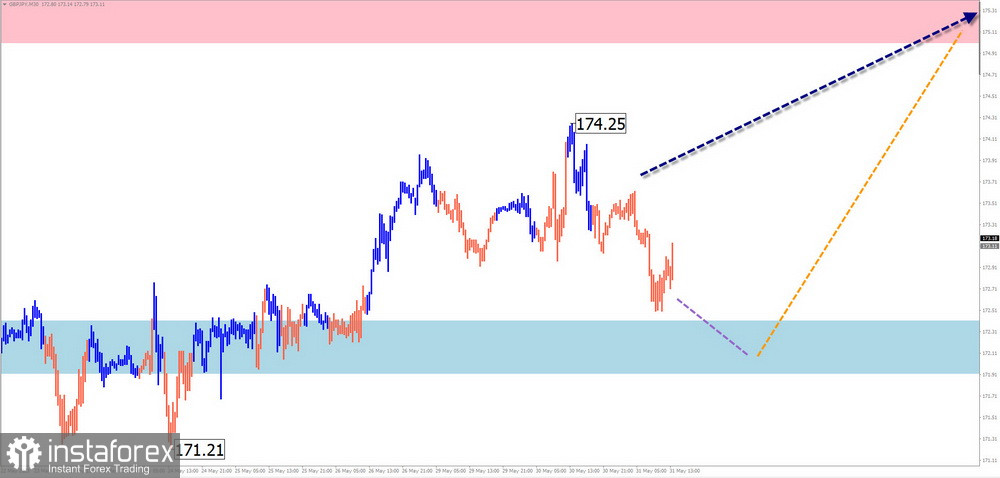
The trend of the British Pound/Japanese Yen pair has increased in the last three years. Since the end of March, the quotes have been forming a final section that remains incomplete until now. At the end of May, the price broke a strong resistance level. After the price consolidates above it, the bullish trend will continue.
Forecast:
The price is expected to move between the nearest opposing zones during the next week. A quote decline is possible in the coming days, reaching the calculated support level. An increase in price towards the upper boundary of the price channel is likely by the end of the upcoming week. The highest volatility can be expected closer to the weekend.
Potential Reversal Zones:
Resistance:
- 175.00/175.50
Support:
- 172.40/171.90
Recommendations:
Selling: Carries a high degree of risk. It may be successful only within individual sessions with reduced volume.
Buying: This can become the main direction for trading after the appearance of confirmed reversal signals near the support zone.
USD/CAD
Analysis:
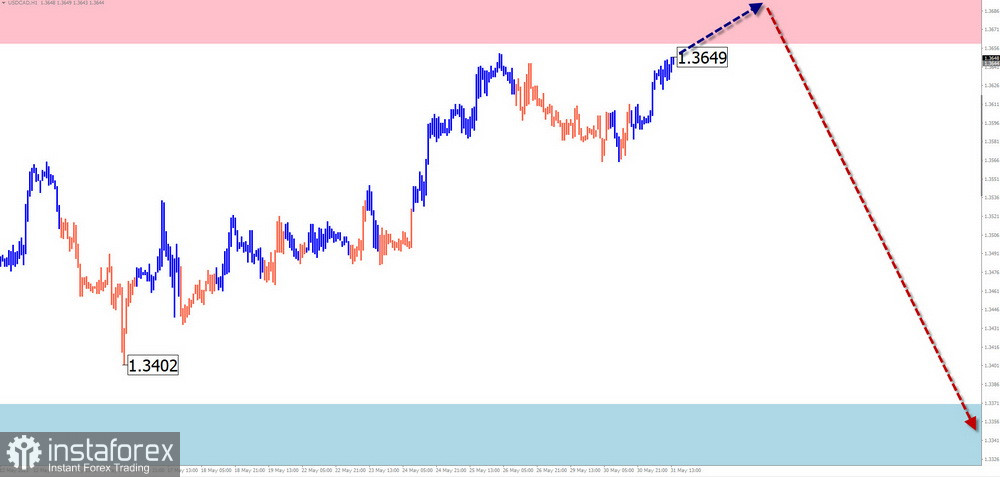
The main Canadian Dollar pair trend has clearly not defined direction since last year. The analysis shows the completion of the structure. The bullish section starting from May 8 has reversal potential, surpassing the level of the previous decline's retracement. The calculated resistance passes along the lower boundary of the potential reversal zone.
Forecast:
During the upcoming week, the ascending course of the pair is expected to complete, followed by a gradual decline in price. Pressure on the resistance zone is possible with a breakthrough of its upper boundary. The highest activity and price decrease can be expected closer to the weekend.
Potential Reversal Zones:
Resistance:
- 1.3660/1.3690
Support:
- 1.3370/1.3320
Recommendations:
Selling: Premature until confirmed reversal signals appear near the corresponding support zone.
Buying: Deals in the next few days may be risky and safer with reduced volume within individual sessions.
NZD/USD
Brief analysis:
The New Zealand Dollar quotes in the main pair have been in a sideways drift since December last year. The extremes of the waveform are a "descending plane" pattern. The analysis of its structure shows the absence of a completed section. Opposing movements do not have reversal potential.
Weekly Forecast:
At the beginning of the upcoming week, there is a high probability of a sideways course of price movement. The range of the potential upward retracement demonstrates the calculated resistance. In the second half, the chances of a change in the direction of course oscillations increase. A price decrease within the weekly period can be expected up to the calculated support.
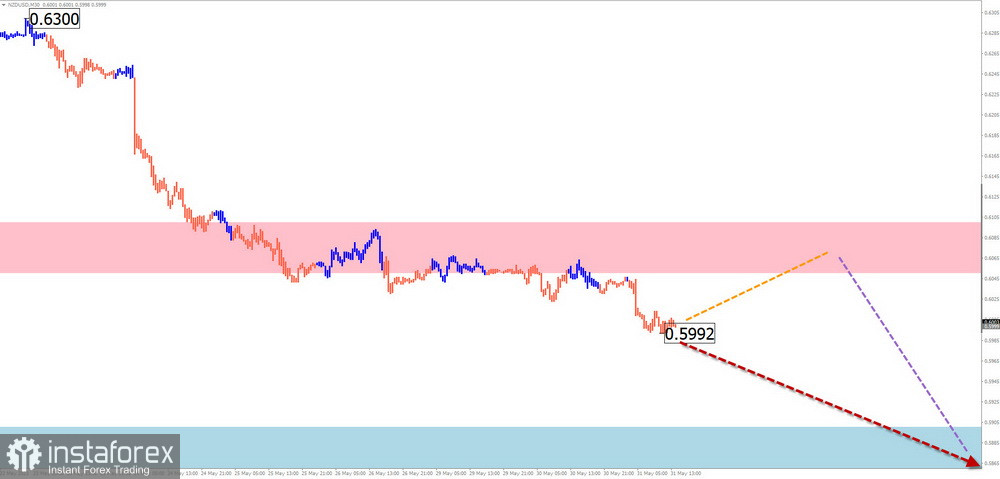
Potential Reversal Zones:
Resistance:
- 0.6050/0.6100
Support:
- 0.5900/0.5850
Recommendations:
Selling: No conditions for such transactions.
Buying: After confirmed reversal signals appear near the resistance zone, they may become the main direction for trading deals.
GOLD
Analysis:
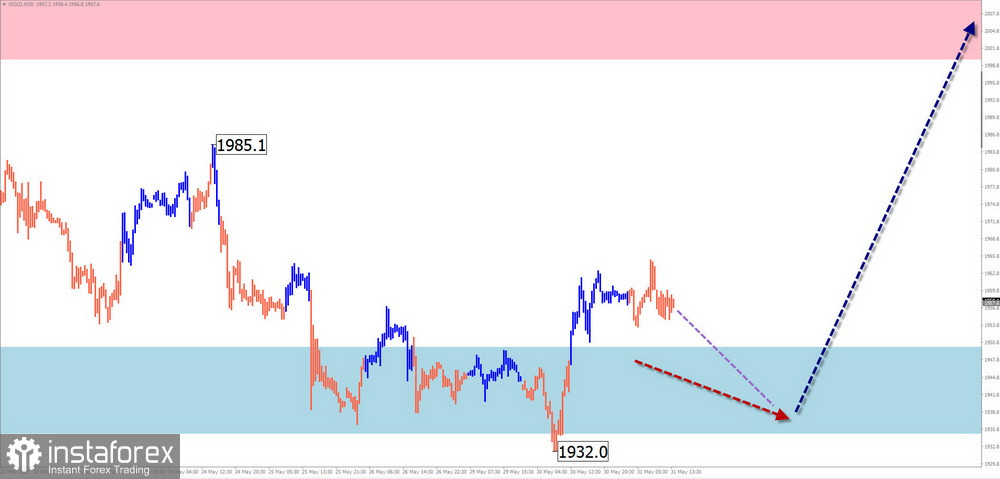
The trend direction in the gold market since the beginning of April of the current year is a descending wave. Within this wave, the price has reached the upper boundary of the intermediate support, from which a correction can be expected. After its completion, the price decline will continue.
Forecast:
At the beginning of the upcoming week, gold quotes may put pressure on the support zone. The second half of the week is expected to be more volatile. A reversal and return of the price to the resistance zone are likely. A breakout of its upper boundary within the upcoming weekly period is unlikely.
Potential Reversal Zones:
Resistance:
- 2000.0/2015.0
Support:
- 1950.0/1935.0
Recommendations:
Buying: It is better to refrain from entering the market for this instrument until the completion of the current upward movement, with a focus on reversal signals at its end.
Selling: This may be profitable with timing within individual sessions and reducing the lot size.
Explanation: In simplified wave analysis (SWA), all waves consist of three parts (A-B-C). The analysis focuses on the last unfinished wave in each timeframe. Dashed lines indicate expected movements.
Attention: The wave algorithm does not consider the duration of movements in time!


