


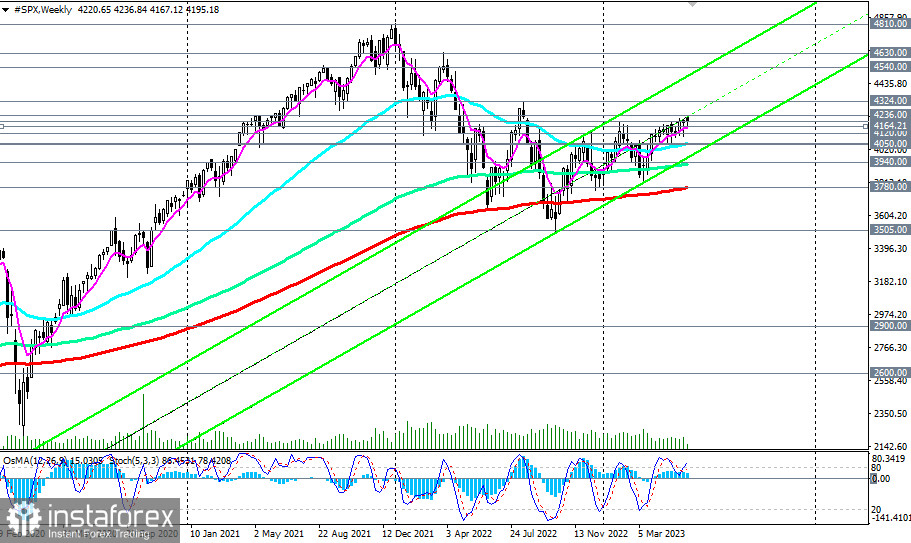
Futures on the broad-market U.S. stock index S&P 500 (CFD #SPX in the trading terminal) maintain a positive momentum, trading in the bullish market zone above key support levels 4060.00 (50 EMA on the weekly chart) and 4050.00 (200 EMA on the daily chart).
Despite the "hawkish" statements from Federal Reserve representatives regarding the prospects of monetary policy, economists believe that it remains accommodative, considering high inflation and a strong labor market. Moreover, the U.S. stock market seems to have turned upward again after the March Federal Reserve meeting, when economists' opinions about the soon-to-be paused tightening cycle gained more prominence. Federal Reserve Chairman Jerome Powell noted that recently received inflation data "indeed indicate the long-awaited easing of price pressures." Although, in his opinion, "much more evidence is needed to be confident about inflation easing."
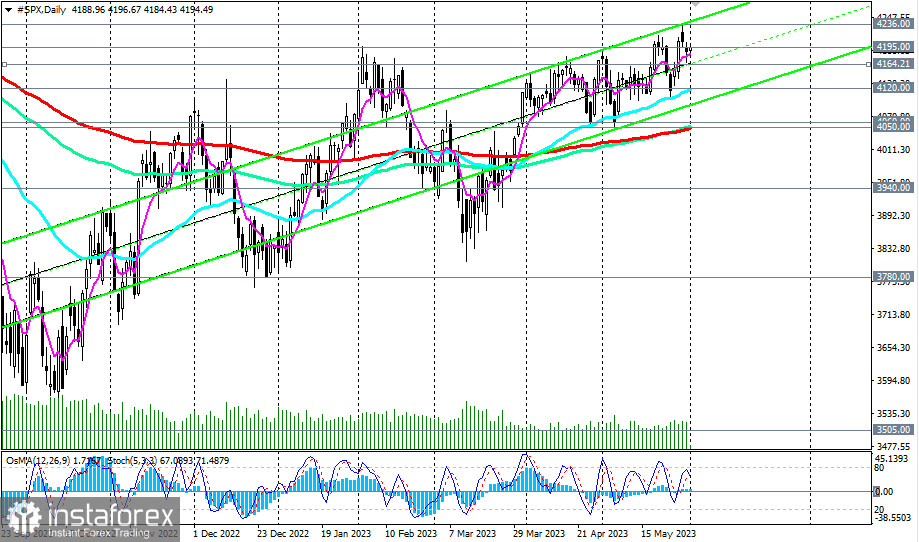
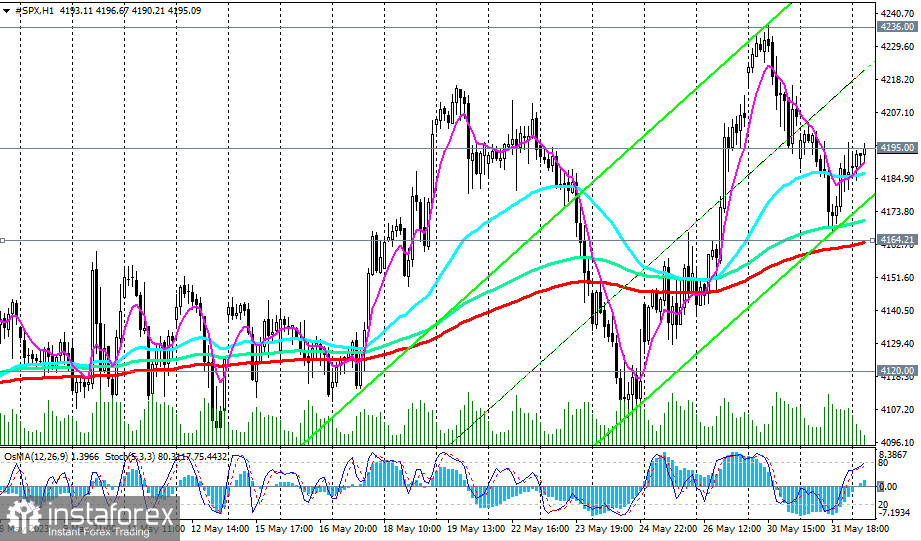
Nevertheless, at the moment, S&P 500 futures are trading near the level of 4195.00. A breakout of this local resistance level and last month's high at 4236.00 will serve as additional evidence in favor of a revival of the global bullish trend in the S&P 500. Above the important short-term support level 4120.00 (200 EMA on the 4-hour chart and 50 EMA on the daily chart), long positions remain intact.
However, a breakthrough of these levels will signal to traders who trade "short" on the S&P500, with the earliest selling signal being a breakout of the short-term support level 4164.00 (200 EMA on the 1-hour chart).
A breakout of the key support level 4050.00 (200 EMA, 144 EMA on the daily chart) will increase the risks of breaking the medium-term bullish market, while a breakout of the support level 3780.00 (200 EMA on the weekly chart) will indicate a long-term breakdown.
However, only a breakthrough of strategic support levels 2900.00 (144 EMA on the monthly chart) and 2600.00 (200 EMA on the monthly chart) would indicate a break in the long-term global bullish trend in the S&P500.
Overall, the "buy-and-hold" strategy remains relevant for the U.S. stock market and its index, the S&P500.
Support levels: 4164.00, 4120.00, 4100.00, 4060.00, 4050.00, 4000.00, 3940.00, 3800.00, 3780.00, 3700.00, 3600.00, 3505.00
Resistance levels: 4195.00, 4236.00, 4324.00, 4540.00, 4630.00, 4810.00


