


5M chart of GBP/USD
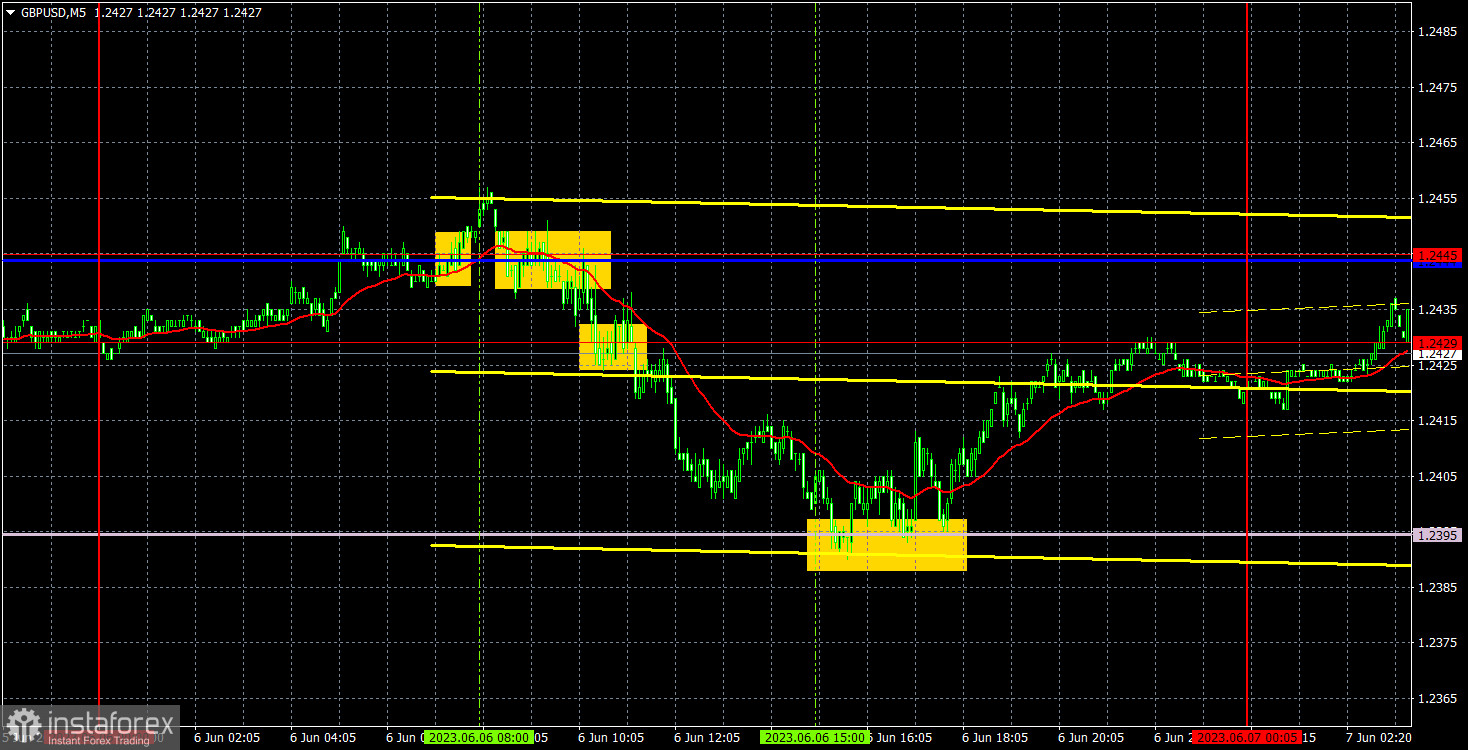
GBP/USD also traded lower on Tuesday, and if you look at the events calendar you would see that the pair had no reason to fall. However, as we have mentioned before, just because the events calendar is empty, it does not mean that the pair will simply stay still. The pound's decline was and remains the most likely scenario, so a 50-60 point decline is not out of the ordinary. The only report of the day, the UK Construction PMI, turned out to be slightly better than forecasts but, as we can see, had no impact on the pair's movement. On the technical side, however, the pair performed quite well, staying precisely between the Senkou Span B and the Kijun-sen lines.
The signals for the pound were almost identical to the signals for the euro, with the only difference being that at the beginning of the European trading session, the pair managed to form a false buy signal by consolidating above a critical line. This signal resulted in a small loss, but was followed by a good sell signal near the same Kijun-sen line, after which the pair fell to the Senkou Span B line. It was appropriate to close shorts near this line so you could gain around 35 pips of profit. Bouncing off the lower boundary of the Ichimoku cloud was also a good signal, and a long position allowed traders to gain about 20 pips. Thus, despite the initial losing trade, the day ended with a profit. Due to the low volatility, the profit was also relatively small.
COT report:
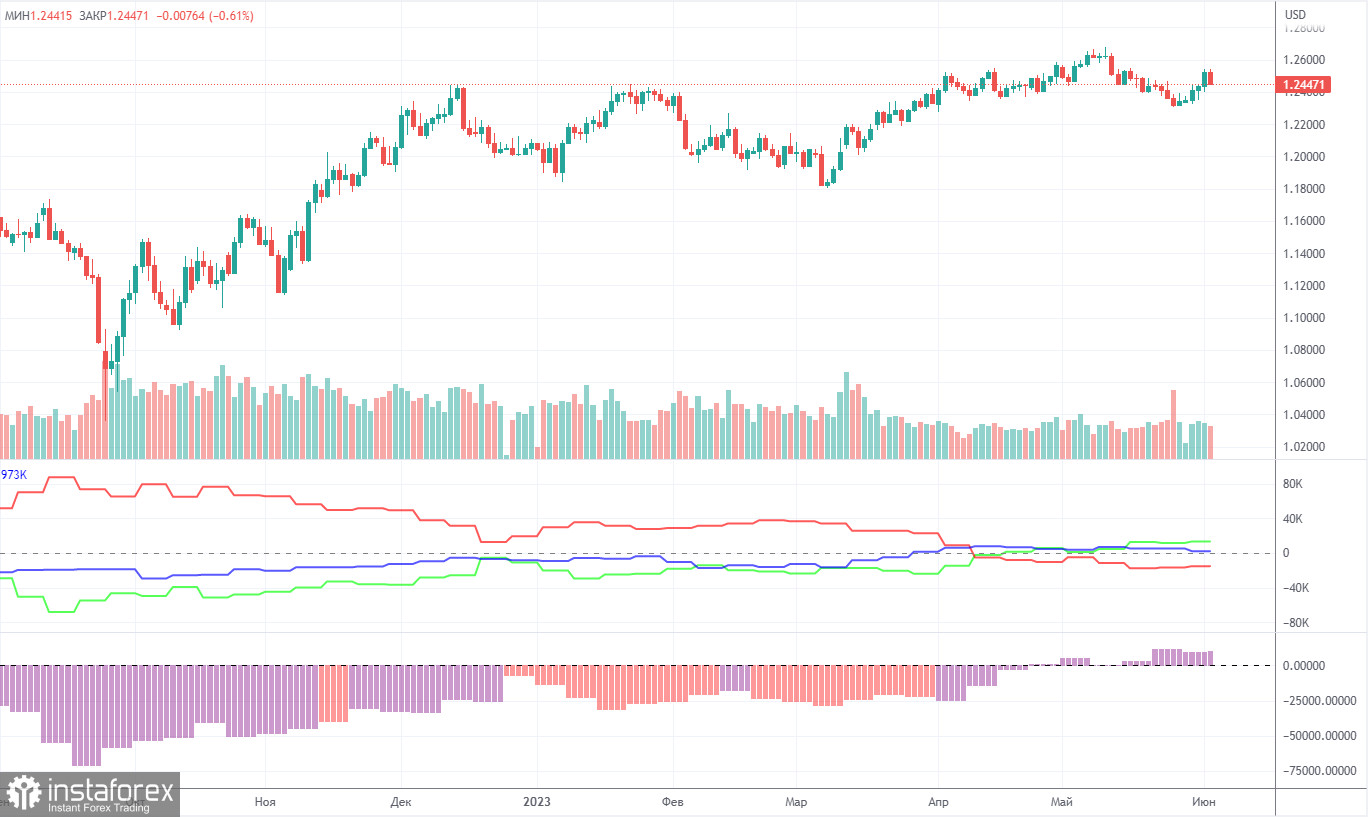
According to the latest report, non-commercial traders opened 1,100 long positions and closed 500 short ones. The net position increased by 600 and remained bullish. Over the past 9-10 months, the net position has been on the rise despite bearish sentiment. The pound is bullish against the greenback in the medium term, but there have been hardly any reasons for that. We assume that a prolonged bear run has begun. COT reports suggest a bullish continuation. However, we can hardly explain why the uptrend should go on.
Both major pairs are in correlation now. At the same time, the positive net position on EUR/USD shows the end of the uptrend. Meanwhile, the net position on GBP/USD is neutral. The pound has gained about 2,300 pips. Therefore, a bearish correction is now needed. Otherwise, a bullish continuation would make no sense even despite the lack of support from fundamental factors. Overall, non-commercial traders hold 57,000 sell positions and 70,300 long ones. We do not see the pair extending growth in the long term.
1H chart of GBP/USD
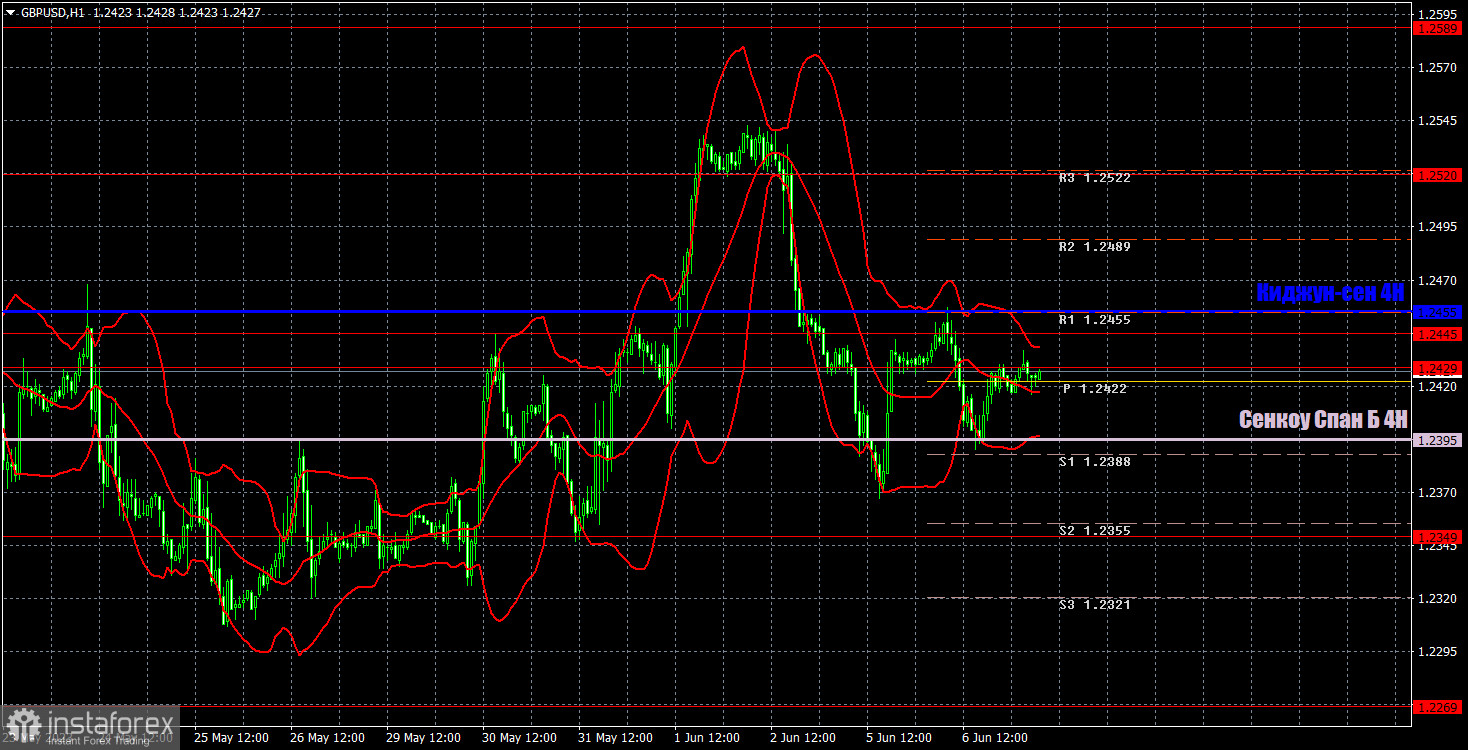
In the 1-hour time frame, the pair started an upward movement and just as quickly ended it. The market insists on buying the pound, which remains significantly overbought and unjustifiably high. However, take note that the market has the right to trade regardless of the fundamental and macroeconomic backdrop. For now, we will consider the strong correction that we've seen last week and expect a revival of the downward movement.
On June 7, trading levels are seen at 1.2269, 1.2349, 1.2429-1.2445, 1.2520, 1.2589, 1.2666, 1.2762. The Senkou Span B line (1.2395) and the Kijun-sen line (1.2455) lines may also generate signals when the price either breaks or bounces off them. A Stop Loss should be placed at the breakeven point when the price goes 20 pips in the right direction. Ichimoku indicator lines can move intraday, which should be taken into account when determining trading signals. There are also support and resistance which can be used for locking in profits.
On Wednesday, there are no important events scheduled in either the UK or the US. Therefore, there will be no specific events to react to during the day, and volatility could be low again, and we can't expect trend-driven movements either.
Indicators on charts:
Resistance/support - thick red lines, near which the trend may stop. They do not make trading signals.
The Kijun-sen and Senkou Span B lines are the Ichimoku indicator lines moved to the hourly timeframe from the 4-hour timeframe. They are also strong lines.
Extreme levels are thin red lines, from which the price used to bounce earlier. They can produce trading signals.
Yellow lines are trend lines, trend channels, and other technical patterns.
Indicator 1 on the COT chart is the size of the net position of each trader category.
Indicator 2 on the COT chart is the size of the net position for the Non-commercial group of traders.


