


Weekly review :
The current short-term bearish trend is expected to quickly reset the neutral or bearish trend. To avoid contradicting the short term, it would be possible to favour short positions (for sale) for the GBP/USD pair as long as the price remains well below the level of 1.2271. The next bearish objective for sellers is set at 1.2220.
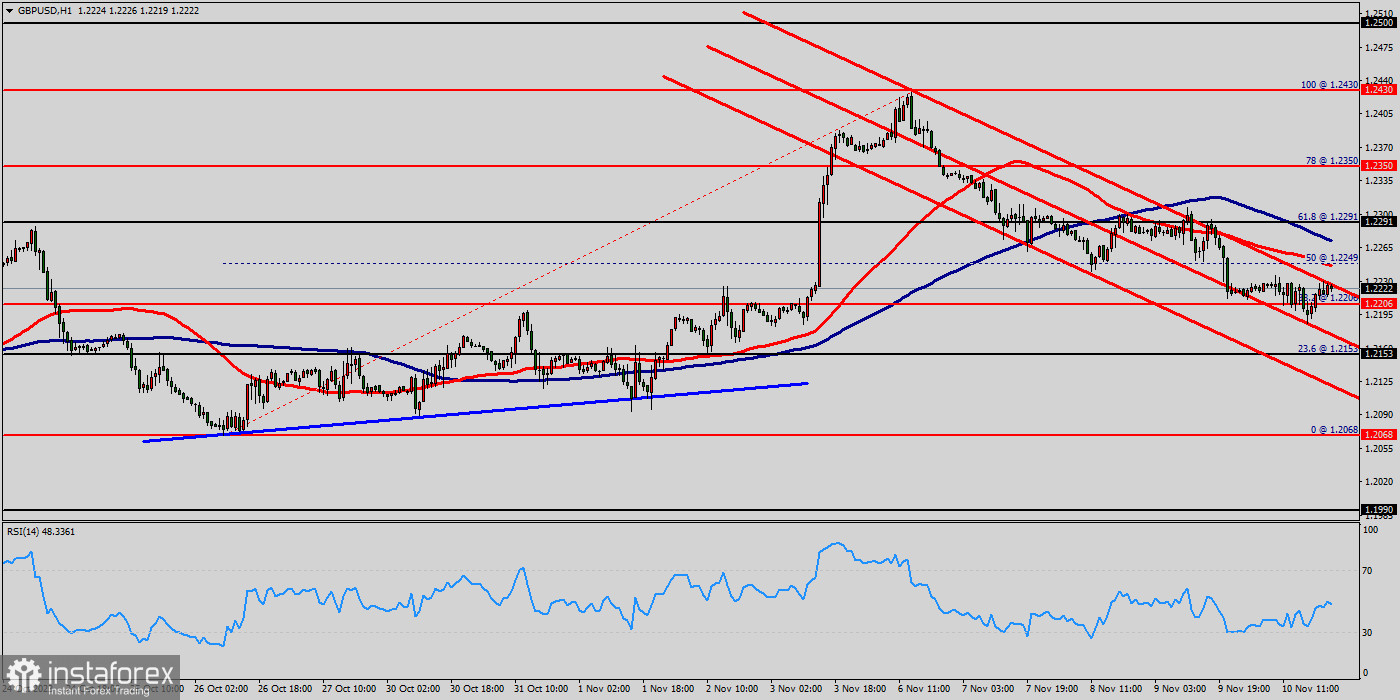
The US Dollar experienced a broad-based weakening as market sentiment improved. the GBP/USD pairmanaged to break above 1.2153 and continued its ascent towards 1.2240. A bearish break of this support would revive the bearish momentum. The sellers could then target the support located at 1.2135. In case of crossing, the next objective would be the support located at 1.2091.
As the basic trend is not clearly displayed, attention should be paid to the price response to the support located at 1.2036. With this support, against the trend traders who want to buy the GBP/USD pair on a buy signal from their trading strategy should not hesitate to act. The Relative Strength Index (RSI) indicator on the one-hour chart managed to hold above 50 despite the latest decline.
On the upside, 1.2181 (psychological level, Fibonacci 61.8% retracement of the latest downtrend) aligns as key resistance. In case the pair stays below that level, 1.2271 (10-period Simple Moving Average) could be tested ahead of 1.2120 (upper limit of the broken descending regression channel) and 1.2091 (psychological level, static level -the last bearish wave).
The GBP/USD pair broke resistance which turned to strong support at the level of 1.2107 this week. The level of 1.2107 is expected to act as major support today. From this point, we expect the GBP/USD pair to continue moving in a bullish trend from the support levels of 1.2107 and 1.2140. Currently, the price is moving in a bullish channel.
This is confirmed by the RSI indicator signaling that we are still in the bullish trending market. Consequently, the first support is set at the level of 1.2107 (horizontal black line). So, the market is likely to show signs of a bullish trend around the spot of 1.2107. In other words, buy orders are recommended above the spot of 1.2107 with the first target at the level of 1.2186; and continue towards 1.2270 (the weekly resistance 2). This would suggest a bearish market because the moving average (100) is still in a positive area and does not show any trend-reversal signs at the moment.
On the other hand, if the GBP/USD pair fails to break through the resistance level of 1.2186 this week, the market will decline further to 1.2107. The pair is expected to drop lower towards at least 1.2147 with a view to test the weekly pivot point. Also, it should be noted that the weekly pivot point will act as minor support today. Also, the level of 1.2147 represents a weekly pivot point for that it is acting as major resistance/support this week. However, if a breakout happens at the resistance level of 1.2336, then this scenario may be invalidated.The GBP/USD pair broke resistance which turned to strong support at the level of 1.2186 yesterday. The level of 1.2186 coincides with a golden ratio (50% of Fibonacci), which is expected to act as major support today.
The Relative Strength Index (RSI) is considered overbought because it is above 40. The RSI is still signaling that the trend is upward as it is still strong above the moving average (100). This suggests the pair will probably go up in coming hours.
Accordingly, the market is likely to show signs of a bullish trend. In other words, buy orders are recommended above 1.2277 with the first target at the level of 1.2336. From this point, the pair is likely to begin an ascending movement to the point of 1.2336 and further to the level of 1.2386. Consequently, the first support is set at the level of 1.2186. So, the market is likely to show signs of a bullish trend around the spot of 1.2186.
If the GBP/USD pair succeed to break through the resistance level of 1.2270, the market will scaling further to 1.2336. This would suggest a bullish market because the RSI indicator is still in a positive area and does not show any trend-reversal signs.
The pair is expected to rise higher towards at least 1.2386 with a view to test the daily resistace 2. The level of 1.2386 will act as strong resistance and the double top is already set at the point of 1.2336. On the other hand, if a breakout happens at the support level of 1.2186, then this scenario may become invalidated.


