


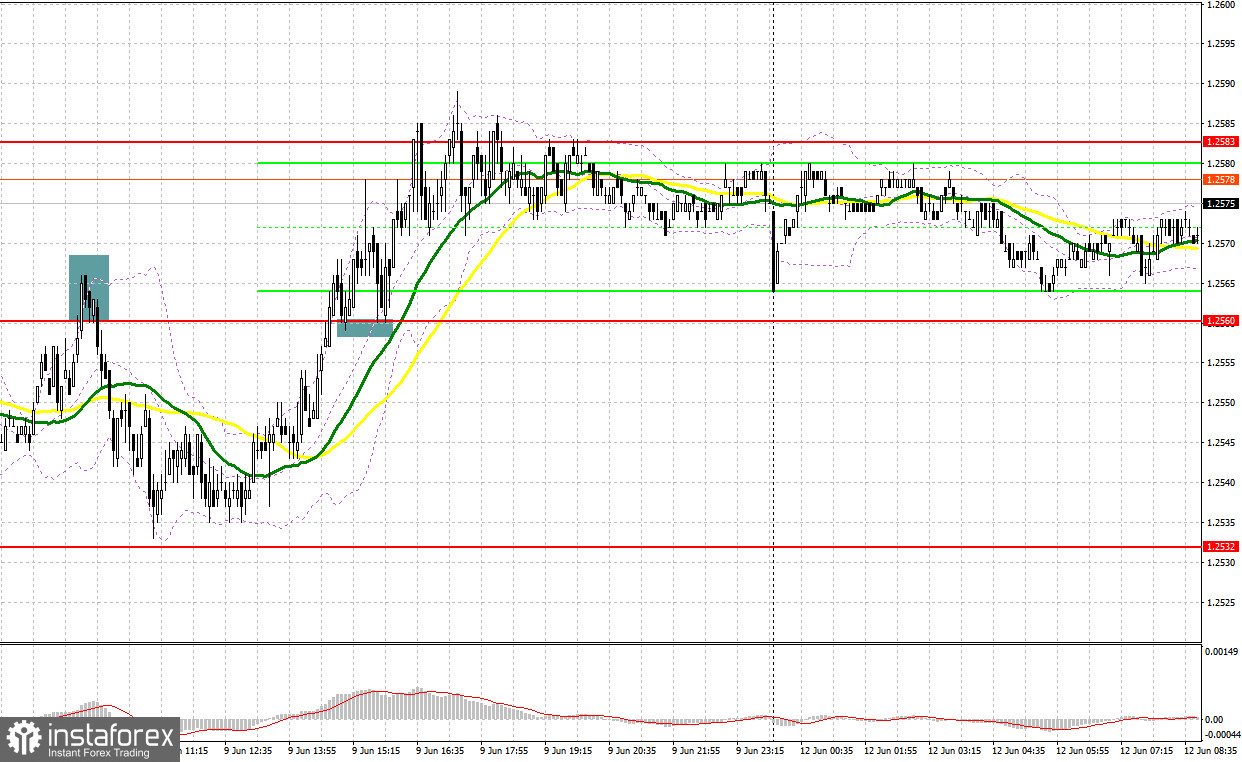
There were several excellent market entry signals on Friday. Let us have a look at the 5-minute chart and analyze what happened. In my morning forecast, I highlighted the level of 1.2560 and recommended making trading decisions with this level in mind. The active defense by bearish traders at the resistance level of 1.2560 allowed opening profitable short positions, resulting in GBP/USD declining substantially and losing 30 pips. Later in the day, the bulls reclaimed 1.2560, and a breakout followed by a successful retest provided a buy signal. This resulted in an upward movement of more than 25 pips.
When to open long positions on GBP/USD:
Today, there is still no noteworthy economic data from the UK, which theoretically should assist the pound's upward momentum against the US dollar. Remarks by Bank of England MPC member Catherine L. Mann and the latest data by the Confederation of British Industry, projecting a 0.4% GDP growth in 2023 and a solid 1.8% increase in 2024, are expected to support the pound in its quest to reach monthly highs. However, the Federal Reserve meeting may cap the pair's upside potential.
Therefore, my approach will focus on short-side maneuvers. A decline and the formation of a false breakout near the new support level at 1.2560, which was established last Friday, would provide an entry point for long positions in continuation of the bullish scenario. The next target for the pair's recovery would be the new resistance level at 1.2587. A breakthrough and sustained consolidation above this range would generate an additional buying signal, propelling the pair towards 1.2611. The most distant target is around 1.2636, where I will take profit. If GBP/USD declines towards 1.2560 amid a lack of bullish activity, downward pressure on the pound sterling will intensify. Only a strong defense of the subsequent area at 1.2534, where key moving averages intersect, along with a false breakout, would provide a signal to open long positions. I plan to buy GBP/USD immediately if it rebounds off 1.2506, targeting an intraday correction of 30-35 pips.
When to open short positions on GBP/USD:
Bears failed to act on Friday and struggled to gain a foothold in the market. Consequently, I intend to go short on the pound sterling only if it surges upwards following a test of the 1.2587 resistance level. Major players are expected to come into play in that area. The formation of a false breakout in that zone, coupled with the MACD divergence, would serve as a sell signal, potentially driving the pair downwards towards 1.2560. A subsequent breakout and an upward retest of this range would deal a significant blow to the positions of bulls, reasserting pressure on GBP/USD ahead of the Federal Reserve meeting and forming a sell signal. GBP/USD may then decline towards 1.2506. The low of 1.2478 remains the most distant target, where I will take profit. However, if GBP/USD continues to rise and bears are idle around 1.2587, it could indicate the continuation of a bullish trend. In such a scenario, I will delay selling until the pair tests the new high at 1.2611. A false breakout of that level would provide an entry point for short positions. Alternatively, if the pair does not fall in that area, I will open short positions on GBP/USD immediately if it bounces off 1.2636, expecting a downward intraday correction of 30-35 pips.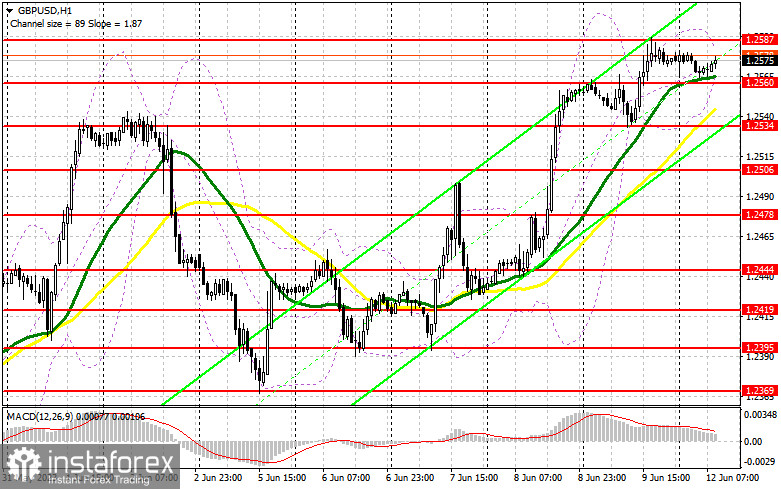
Commitment of Traders (COT) report:
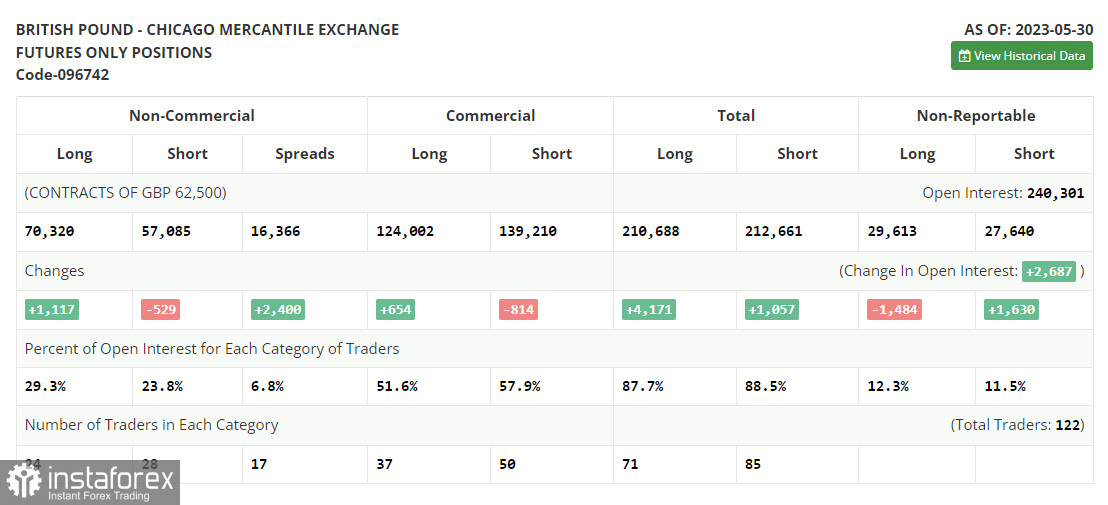
In the COT (Commitment of Traders) report for May 30, we observed a decrease in short positions and an increase in long positions. The pound sterling experienced a significant decline, but positive economic data released last week helped halt the descent and partially offset the pound's May losses. However, expectations of continuing Fed interest rate hikes limit the pair's upside potential. Despite the Bank of England's pause in June, an overheated labor market will prevent the committee from halting the cycle of monetary policy tightening for long. Faced with further uncertainty from the Bank of England's monetary policy, this will exert clear pressure on GBP. The latest COT report indicates that non-commercial short positions decreased by 529 to 57,085, while non-commercial long positions increased by 1,117 to a level of 70,320. As a result, the non-commercial net position went up to 13,235 from 11,059 the previous week. The weekly price declined to 1.2398 from 1.2425.
Indicator signals:
Moving Averages
Trading is taking place above the 30 and 50-day moving averages, indicating the development of an uptrend.
Note: The author considers the period and prices of the moving averages on the H1 hourly chart, which differs from the general definition of classical daily moving averages on the D1 daily chart.
Bollinger Bands
If GBP/USD declines, it will find support near the lower boundary of the indicator around 1.2560.
Description of indicators
Moving average (moving average, determines the current trend by smoothing out volatility and noise). Period 50. It is marked yellow on the chart. Moving average (moving average, determines the current trend by smoothing out volatility and noise). Period 30. It is marked green on the chart. MACD indicator (Moving Average Convergence/Divergence - convergence/divergence of moving averages) Quick EMA period 12. Slow EMA period to 26. SMA period 9 Bollinger Bands (Bollinger Bands). Period 20 Non-commercial speculative traders, such as individual traders, hedge funds, and large institutions that use the futures market for speculative purposes and meet certain requirements. Long non-commercial positions represent the total long open position of non-commercial traders. Short non-commercial positions represent the total short open position of non-commercial traders. Total non-commercial net position is the difference between the short and long positions of non-commercial traders.

