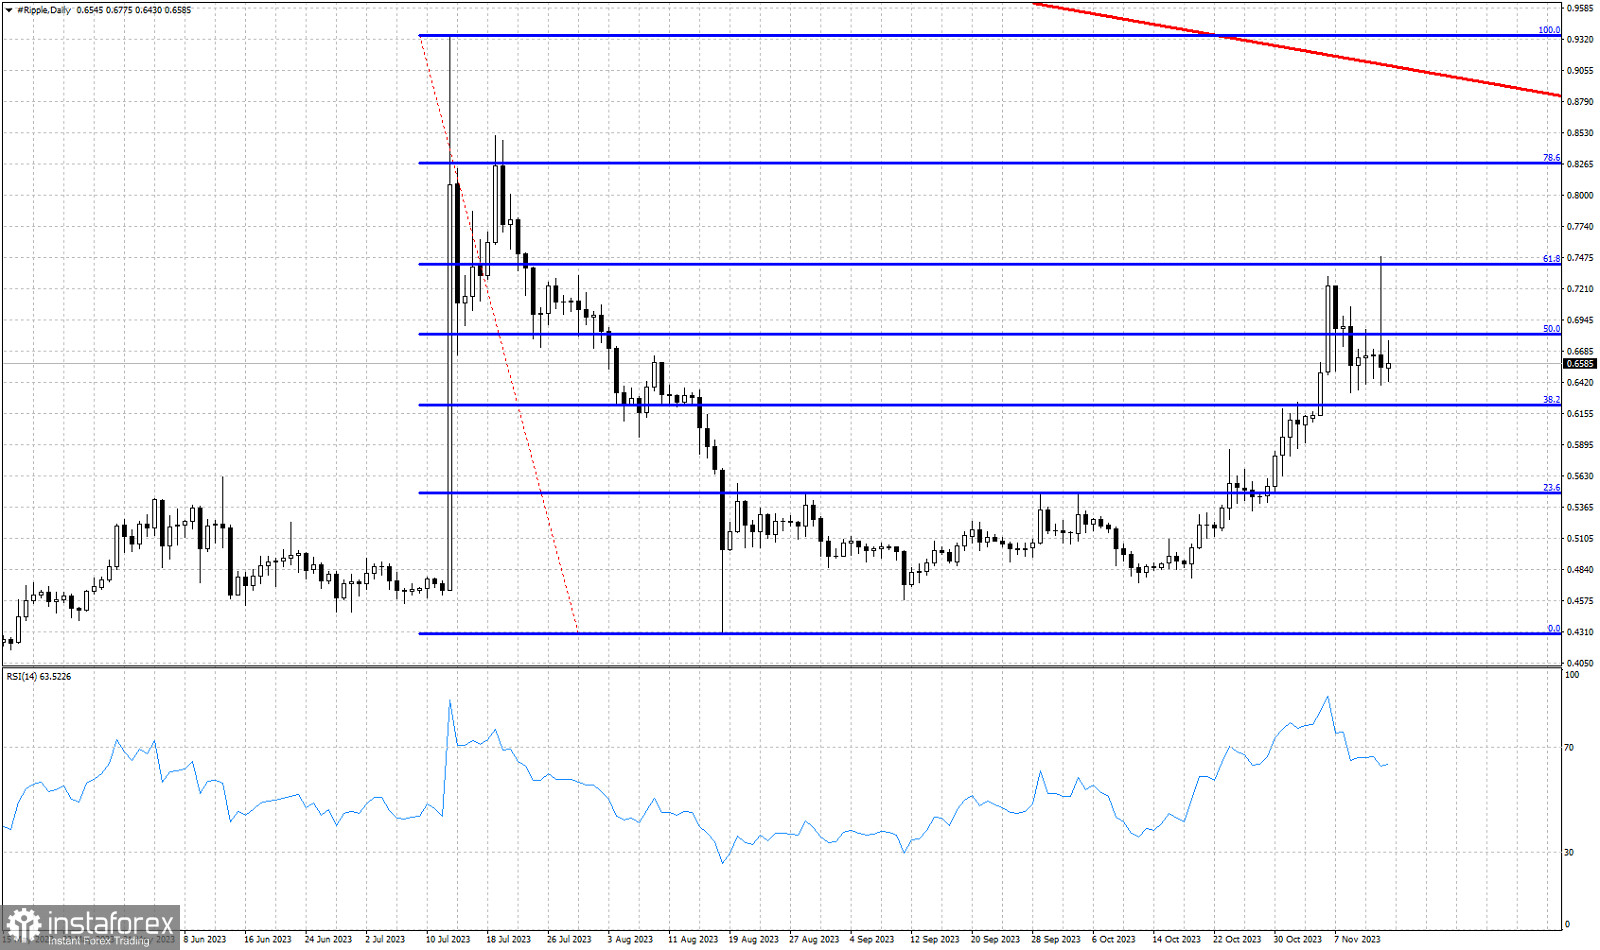
Blue lines- Fibonacci retracement levels
Red line- major resistance trend line
XRPUSD is trading around $0.65. Yesterday price formed a new higher high but it was shortlived. Price reached $0.7484 but failed to close on the positive side. On the contrary price pulled back and closed in negative territory. The Daily candlestick formed another long upper tail suggesting weakness and inability by bulls to maintain their gains. The new high touched the 61.8% retracement resistance and got rejected. Price closed yesterday around $0.6550. Each time XRPUSD reached $0.74-$0.75 area sellers dominate and push price lower. The new higher high in price was not followed by a higher high in the RSI. The RSI formed a bearish divergence and is turning lower from overbought levels. Short-term support is at $0.6330 and a break below this level will be the signal for the start of the pull back.


