


Analysis of EUR/USD 5M.
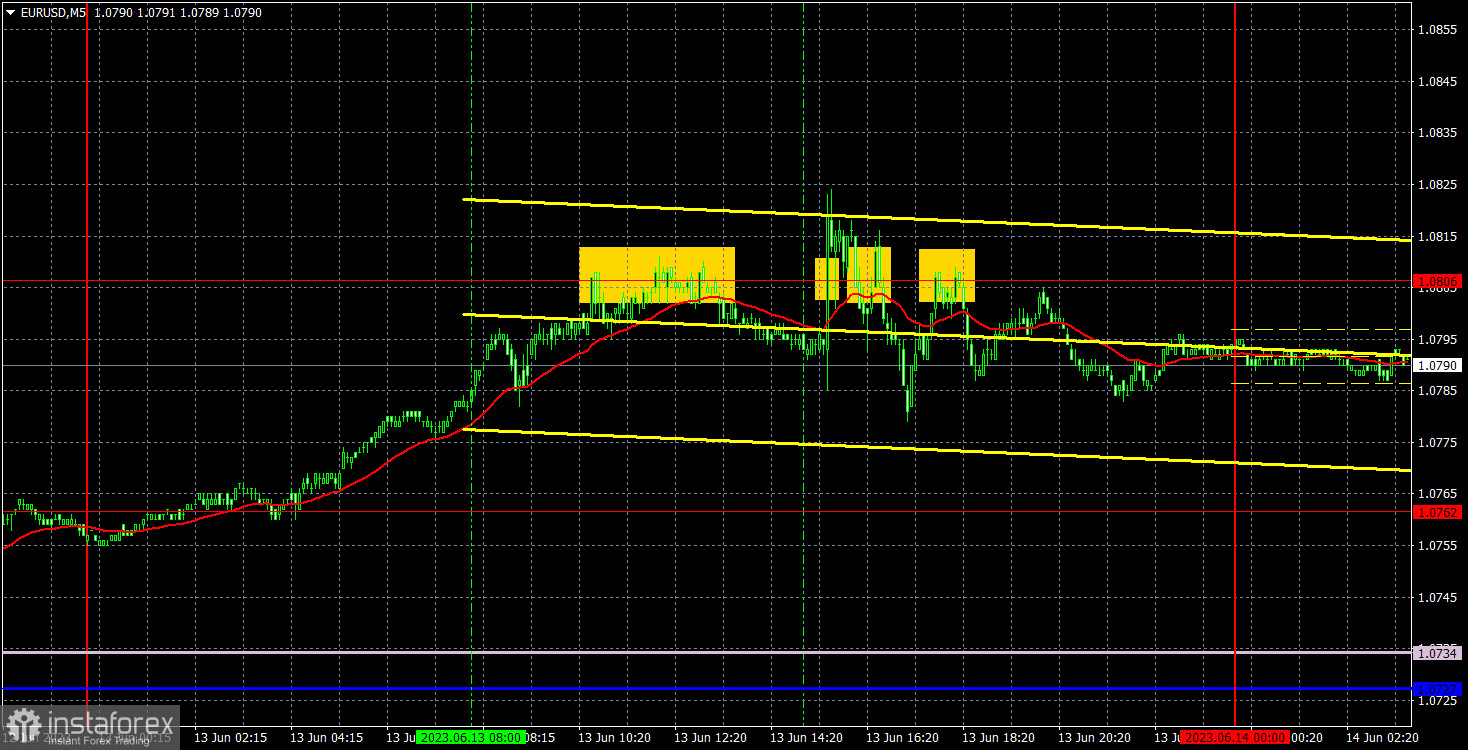
The EUR/USD pair has been growing for 2 days in a row. The euro started an upward movement at night. It seems that traders priced in the inflation report in advance. They predicted a slowdown. If inflation declines significantly, it will lower the likelihood of another rate hike by the Fed in June or July. The Fed will announce its rate decision tonight. There is no doubt that the rate will remain unchanged. A rate hike in July is also in question. That is why the US dollar was trading lower on Tuesday. There were no important reports or events in the eurozone.
The first buy signal occurred at night when the pair broke through the 1.0762 level. At the time of the opening of the European session, the price went far from the entry point. For this reason, I did not open new positions. After that, a sell signal near the level of 1.0806 appeared. However, before the publication of the inflation report, it was better to close positions and leave the market. Moreover, inflation dropped more sharply than predicted. A fall in the US dollar was likely. So, traders ignored a buy signal after the release of the report. The two subsequent sell signals indicated a rise in the pair, not its decrease.
COT report:
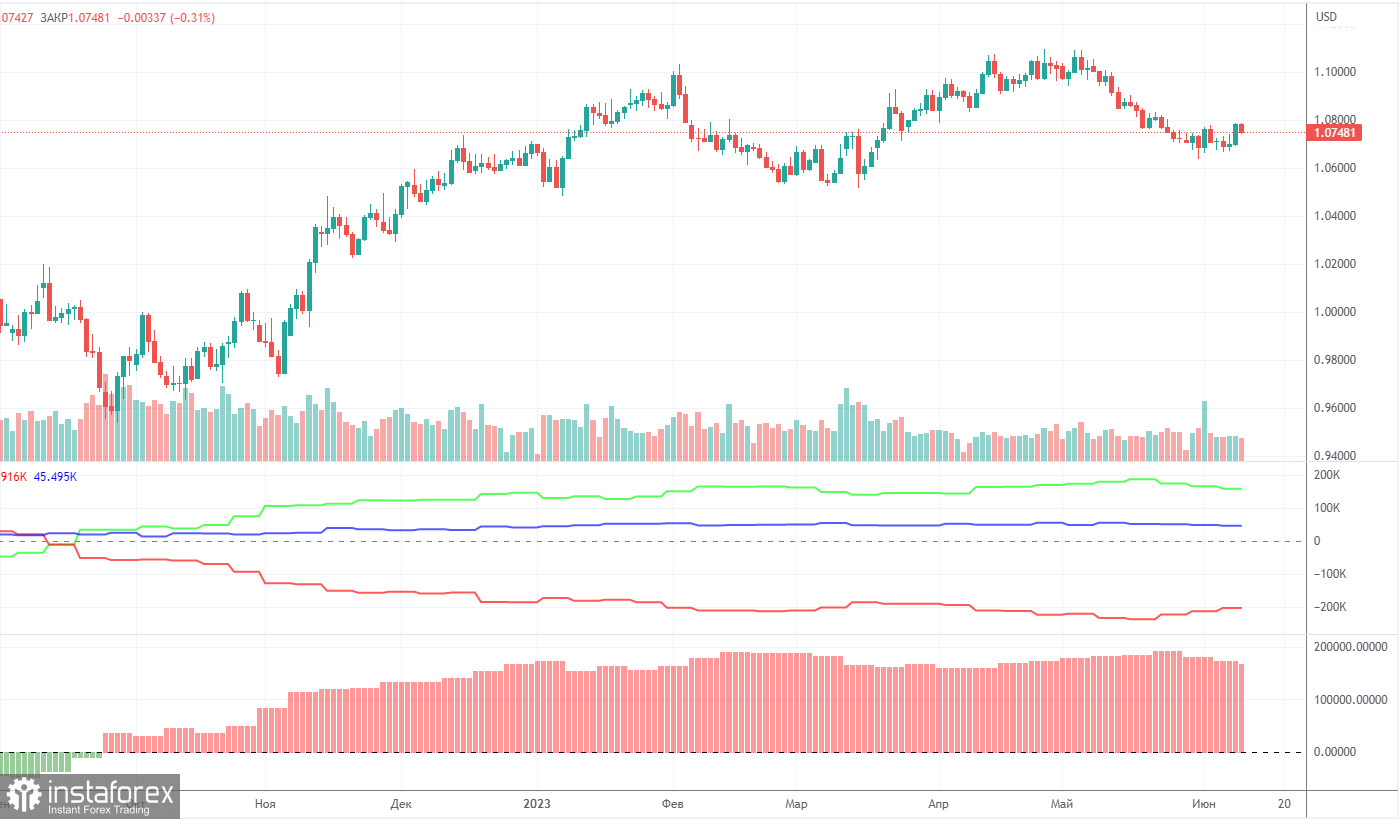
On Friday, a new COT report for June 6 was released. In the last 9 months, COT reports have fully corresponded to what is happening on the market. The chart above clearly shows that the net position of big traders (the second indicator) began to grow again in September 2022. At the same time, the euro resumed an upward movement. The net position of non-commercial traders is bullish. The euro is trading at its highs against the US dollar.
I have already mentioned that a fairly high value of the "net position" indicates the end of the uptrend. The first indicator also signals such a possibility as the red and green lines are very far from each other. It often occurs before the end of the trend. The euro tried to start falling a few months ago but there was only a pullback. During the last reporting week, the number of long positions of the "Non-commercial" group of traders decreased by 5,700 and the number of short positions rose by 1,500. The number of long positions is higher than the number of short ones. This is a very large gap. The number of long positions is 59,000 higher than short ones. The difference is more than three times. The correction has begun. Yet, it may not be a correction but the start of a new downtrend. At this time, it is clear that the pair is likely to resume a downward movement without COT reports.
Analysis of EUR/USD 1H.
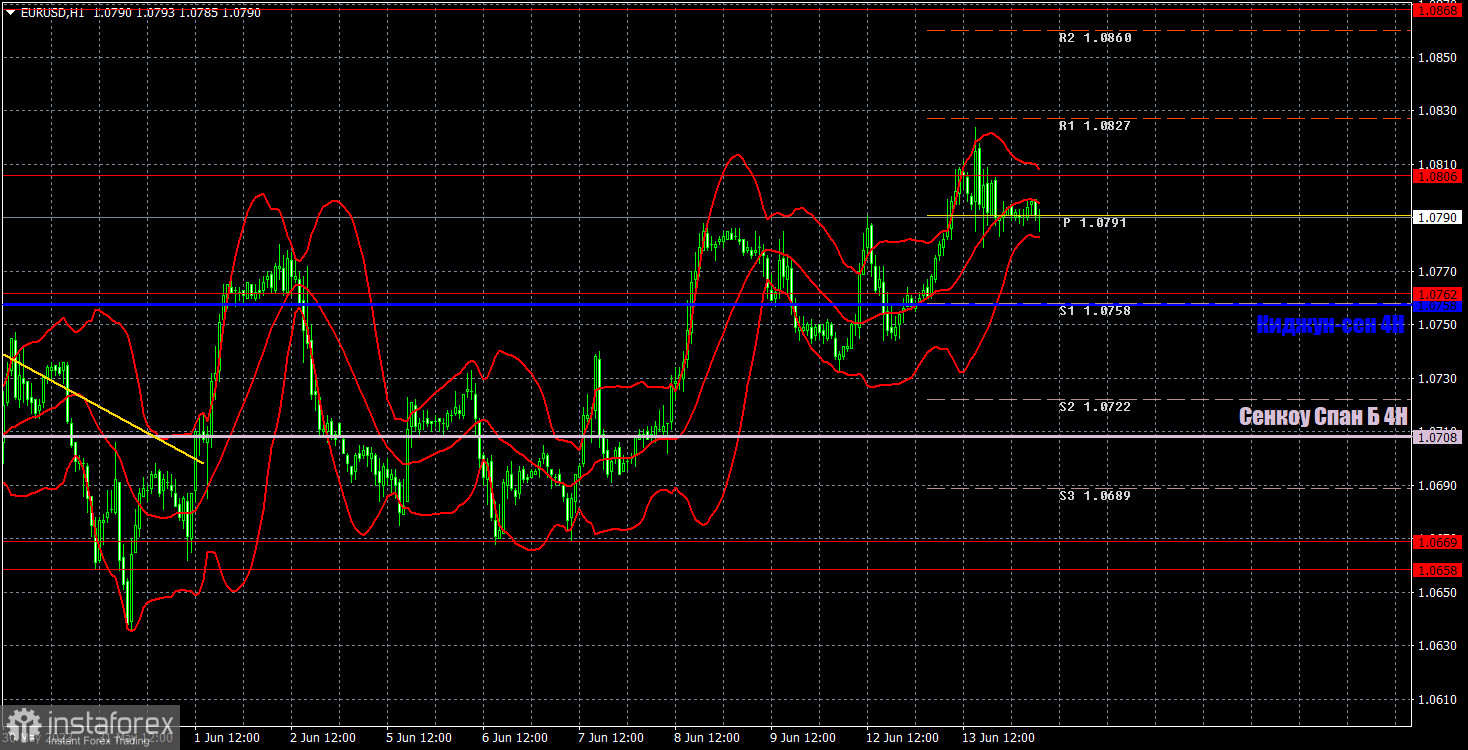
On the 1H, the pair is trying to start an upward correction but there are no drivers for growth. I have already mentioned that this week the trajectory of the pair could be completely unpredictable due to important events. The euro may continue an upward correction. However, after that, it could resume its medium-term decline. So far, the uptrend continues as the pair is located above the lines of the Ichimoku indicator.
On June 14, one should pay attention to the following levels: 1.0537, 1.0581, 1.0658-1.0669, 1.0762, 1.0806, 1.0868, 1.0943, 1.1092, as well as the Senkou Span B (1.0708) and Kijun-sen (1.0758) lines. The lines of the Ichimoku indicator can move during the day. Bear it in mind when determining trading signals. There are also support and resistance levels but they do not provide signals, e.g. bounces or breakouts from extreme levels and lines. Do not forget about placing a Stop Loss order at breakeven if the price moves in the right direction by 15 pips. It will you avoid losses if the signal turns out to be false.
The EU will reveal industrial production data today. The US will unveil the Producer Price Index. Traders are likely to ignore the first report. They are more interested in the US PPI. However, the highlight of the day and week is the Fed meeting. The central bank results will announce its rate decision in the evening.
What's on charts:
Support and resistance levels (resistance /support) are thick red lines near which the trend may end. They do not provide trading signals.
The Kijun-sen and Senkou Span B lines are the lines of the Ichimoku indicator plotted to the H1 chart from the 4H one. They are strong lines.
Extreme levels are thin red lines from which the price bounced earlier. They provide trading signals.
Yellow lines are trend lines, trend channels, and any other technical patterns.
Indicator 1 on the COT charts is the net position size of each category of traders.
Indicator 2 on the COT charts is the net position size for the "Non-commercial" group of traders.


