Trading recommendations
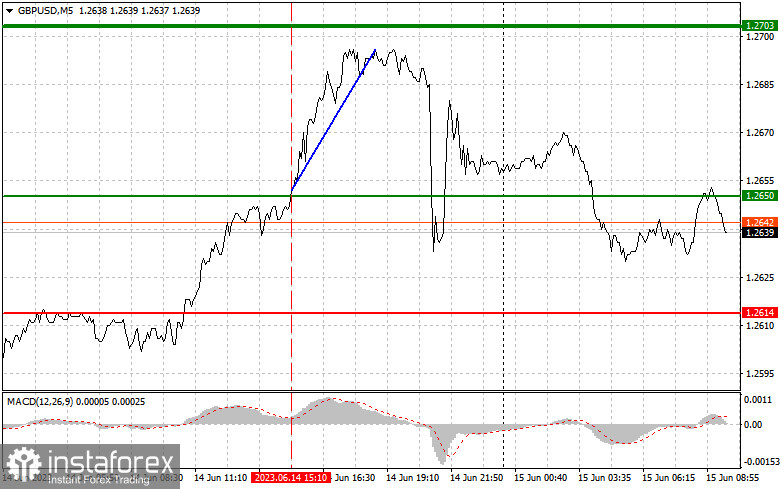
The test of 1.2650 occurred at a time when the MACD indicator started to rise from the zero level. It confirmed the correctness of an entry point into long positions. As a result, the pair climbed by about 50 pips.

GDP figures were in line with economists' forecasts. Traders ignored industrial production data even despite weak indicators. So, the pound sterling retained its upward movement. However, it did not last long. It halted its rise in the afternoon after the Fed skipped a rate increase but announced that it was not going to end aggressive tightening. The economic calendar for the UK is empty today. The pressure on the pound sterling may increase. Therefore, I will stick to scenario No. 1.
Buy signal
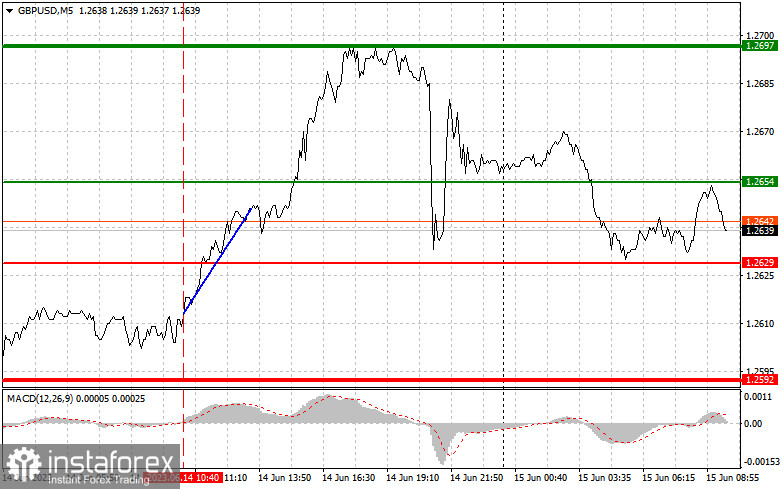
Scenario No.1: you could buy the pound sterling if the price reaches 1.2654 plotted by the green line on the chart with the target level at 1.2697 (thicker green line on the chart). I would recommend leaving the market at 1.2697 and then selling the pound sterling in the opposite direction, bearing in mind a 30-35-pip downward move from the market entry point. The pair could rise amid a strong bullish. Important! Before opening long positions, make sure that MACD is above the zero mark and it has just started to climb from it.
Scenario No.2: it is also possible to buy the pound sterling today in case of two consecutive tests of 1.2629. At this moment the MACD indicator should be in the oversold area. This will limit the pair's downside potential and lead to an upward market reversal. You can expect a rise to 1.2654 and 1.2697.
Sell signal
Scenario No. 1: you could sell GBP today only after the price drops below 1.2629 (red line on the chart). This will lead to a rapid decline in the pair. The target for sellers will be the 1.2592 level where I recommend closing sell orders and immediately opening buy orders, expecting a move of 20-25 pips in the opposite direction from the level. The pressure on the pound sterling could escalate in the afternoon. Important! Before selling, make sure that the MACD indicator is below the zero mark and has just started to fall from it.
Scenario No. 2: it is also possible to sell GBP today in the case of two consecutive price tests of 1.2654. The MACD indicator should be in the overbought area. This will limit the pair's upside potential and lead to a downward market reversal. You can expect a decrease to the levels of 1.2629 and 1.2592.

What we see on the trading chart:
A thin green line is a key level at which you can place long positions on GBP/USD.
A thick green line is the target price since the price is unlikely to move above it.
A thin red line is a level at which you can place short positions on GBP/USD.
A thick red line is the target price since the price is unlikely to move below it.
A MACD line - when entering the market, it is important to pay attention to the overbought and oversold zones.
Important: Novice traders need to be very careful when making decisions to enter the market. Before the release of important reports, it is better to stay out of the market to avoid sharp fluctuations in the price. If you decide to trade during the news release, place Stop Loss orders to minimize losses. Without Stop Loss orders, you can lose the entire deposit, especially if you do not use money management and trade in large volumes.
Notably, for successful trading, it is necessary to have a clear trading plan. Relying on spontaneous trading decisions based on the current market situation is a losing strategy for an intraday trader.


