


EUR/USD
Higher timeframes
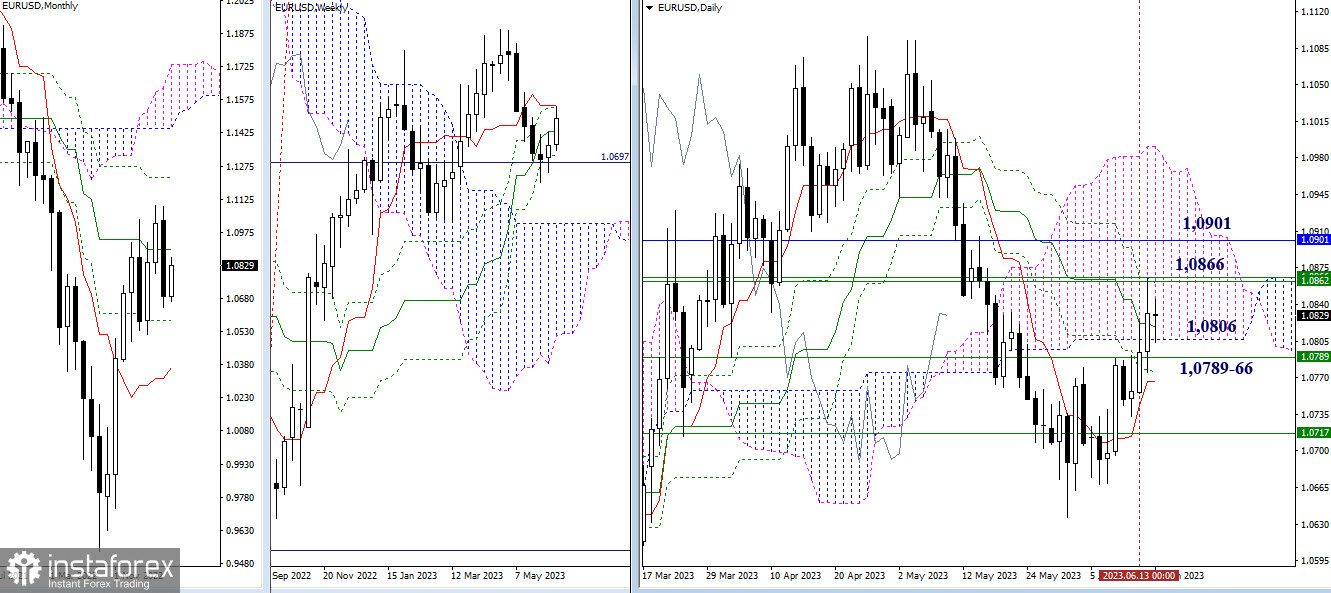
Bullish players continued their ascent yesterday and tested the resistance of weekly levels (1.0862-66). Consolidation above will redirect attention towards targets such as the monthly medium-term trend (1.0901) and the upper boundary of the daily cloud (1.0991). The zone of attraction and support is currently formed by the combination of daily levels and the weekly medium-term trend at the levels of 1.0806 - 1.0789 - 1.0766.
H4 - H1
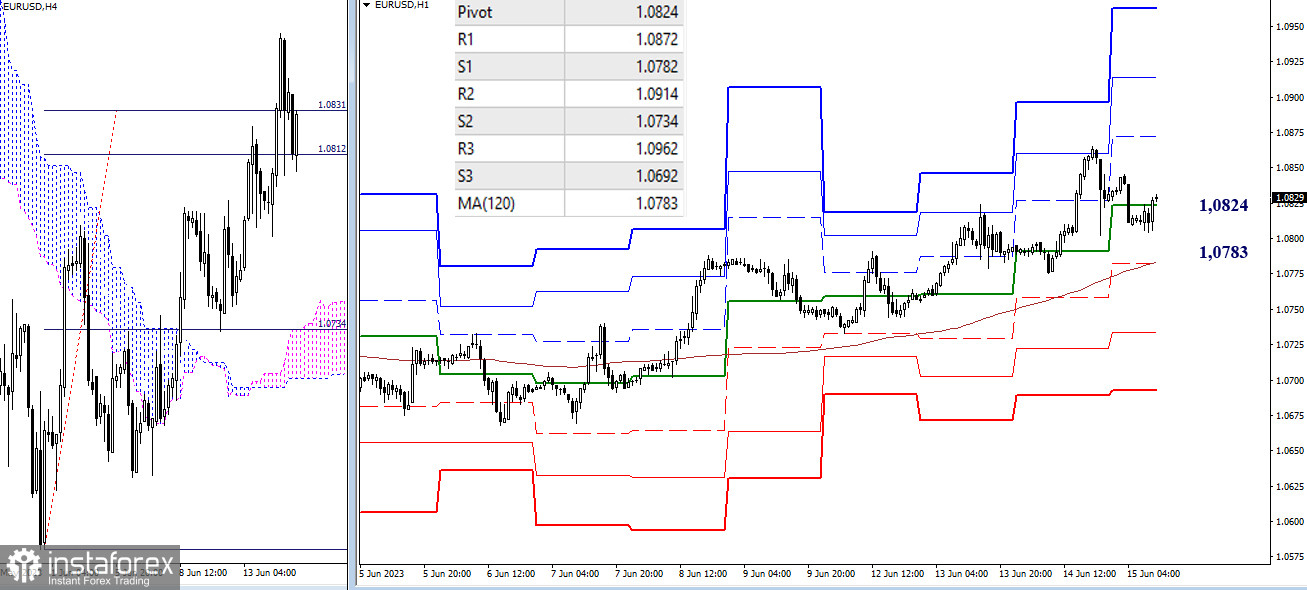
Yesterday's downward correction ended with new bullish activity, allowing bulls to reach a new high and continue the upward trend. Bulls found the H4 targets insufficient and headed towards R2 and weekly benchmarks around 1.0862-66. Currently, we are observing activity within the correction zone again. The resistance levels of classic pivot points serves as upward targets from lower timeframes, located at 1.0872 - 1.0914 - 1.0962 today. Key levels from lower timeframes currently provide attraction and support, ranging from 1.0824 (central pivot point) to 1.0783 (weekly long-term trend). A breakdown of key levels will shift the balance of power in favor of strengthening bearish sentiment, with additional downward targets within the day being the supports of classic pivot points (1.0734 - 1.0692).
***
GBP/USD
Higher timeframes
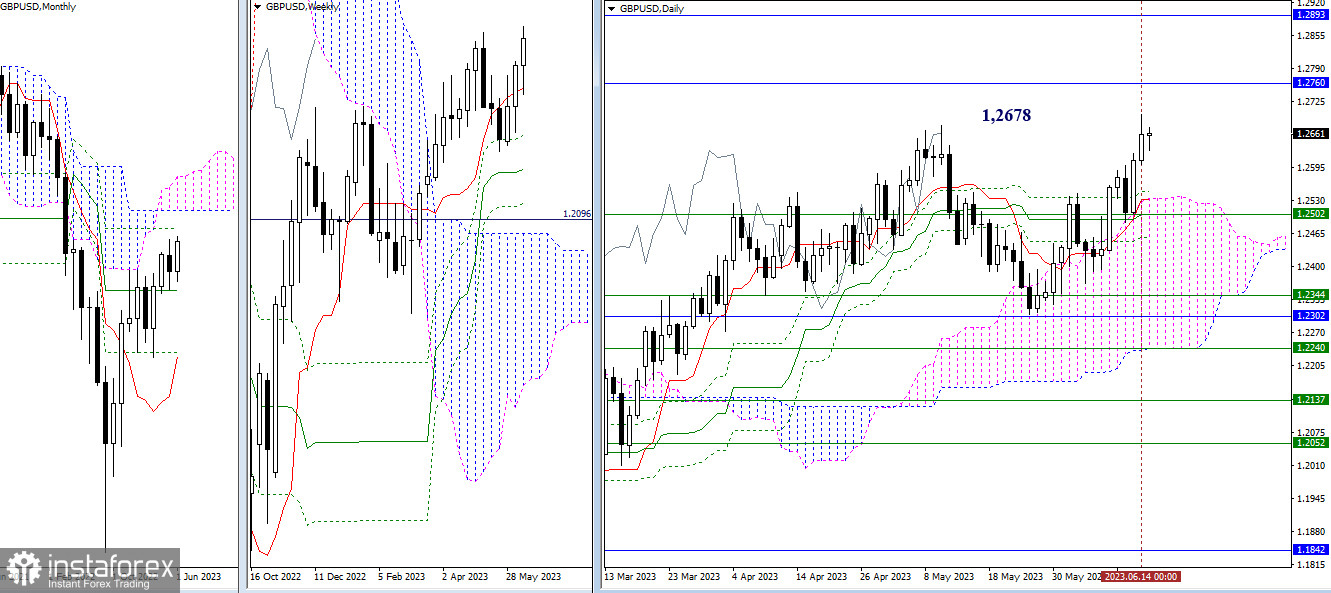
Bulls continued their ascent yesterday and reached May's all-time high (1.2678). As a result, they now face resistance from the highest timeframe—the monthly levels of 1.2760 and 1.2893. The nearest support zone in the current situation is formed by the accumulation of daily levels, which strengthens the weekly short-term trend (1.2502).
H4 - H1
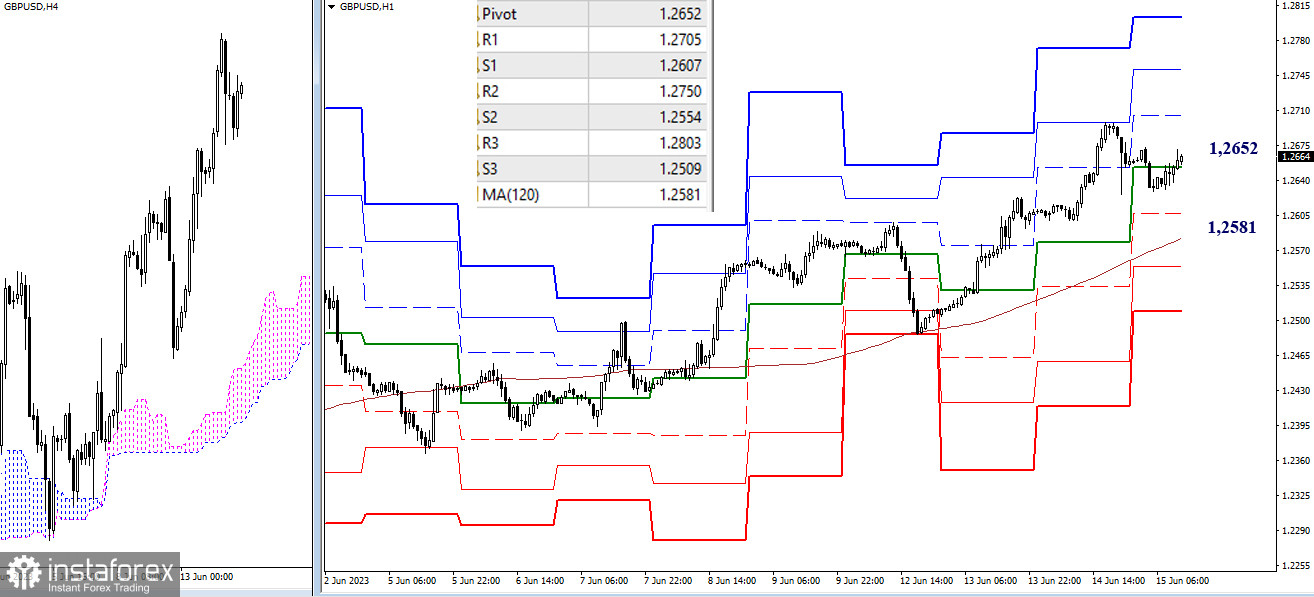
Currently, the pair is trading in the correction zone on the lower timeframes, where the key levels—central pivot point of the day (1.2652) and the weekly long-term trend (1.2581)—provide attraction and support. If the correction ends and the ascent continues, the targets within the day will be the resistances of classic pivot points (1.2705 - 1.2750 - 1.2803). However, if the correction leads to a breakdown of the weekly long-term trend (1.2581), the next downward targets within the day will be the supports of classic pivot points (1.2554 - 1.2509).
***
The technical analysis of the situation uses:
Higher timeframes - Ichimoku Kinko Hyo (9.26.52) + Fibo Kijun levels
Lower timeframes - H1 - Pivot Points (classic) + Moving Average 120 (weekly long-term trend)


