


Analyzing Thursday's trades:
GBP/USD on 30M chart
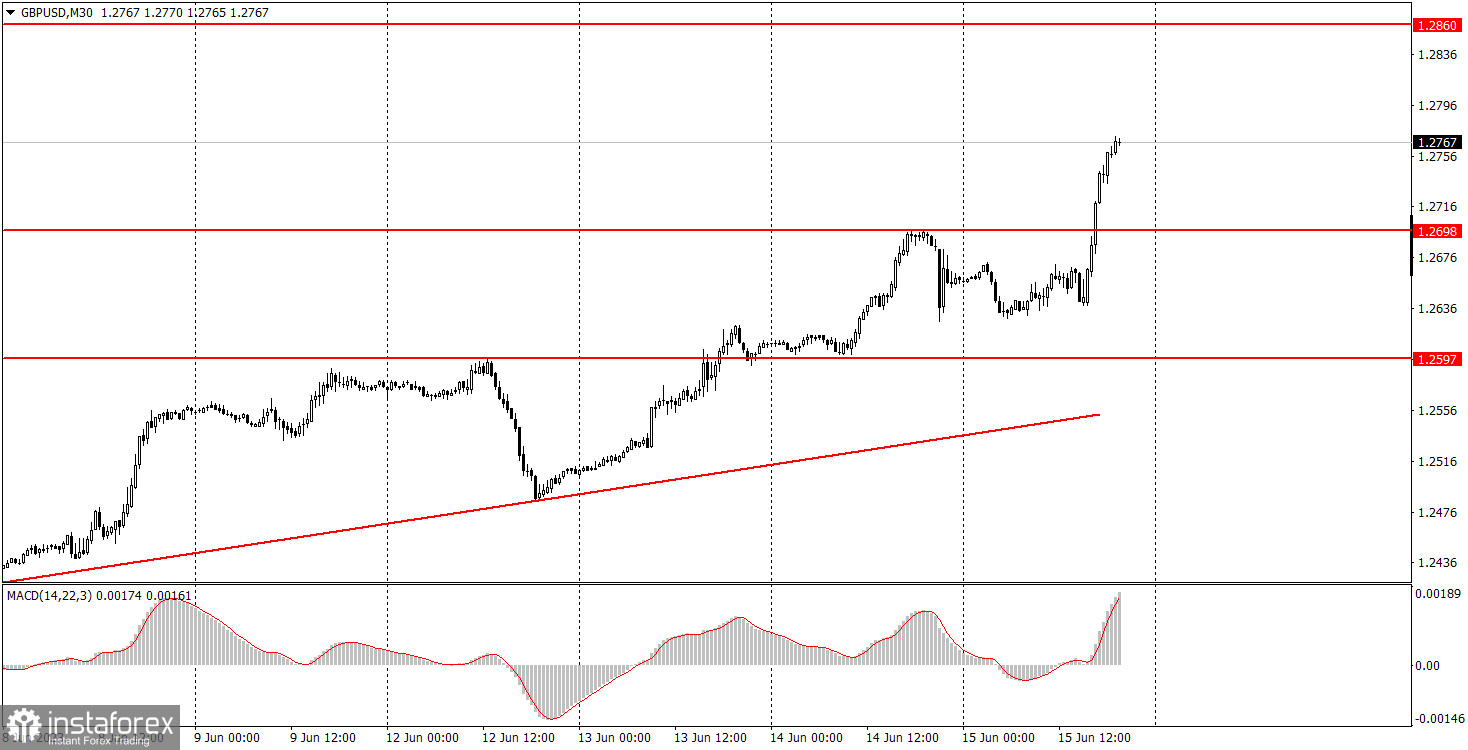
GBP/USD accelerated on Thursday, which seems unstoppable. Despite significant reasons for buying the British pound this week, its overall growth still appears strange and illogical. For example, the pound reacted to the "hawkish" outcomes of the European Central Bank meeting and rather mediocre US data. This growth may seem justified if we overlook the fact that the pound also tends to rise without clear reasons in most cases. It has gained about 2400 pips against the dollar in the past 10 months, with the maximum correction during this period being only 600 pips. Perhaps the British currency is rising in anticipation of next week's Bank of England meeting, but it is difficult to say what exactly traders are so enthusiastically waiting for when they're already aware of the rate hike. The British central bank has never hinted at a pause or the end of the tightening cycle.
GBP/USD on 5M chart
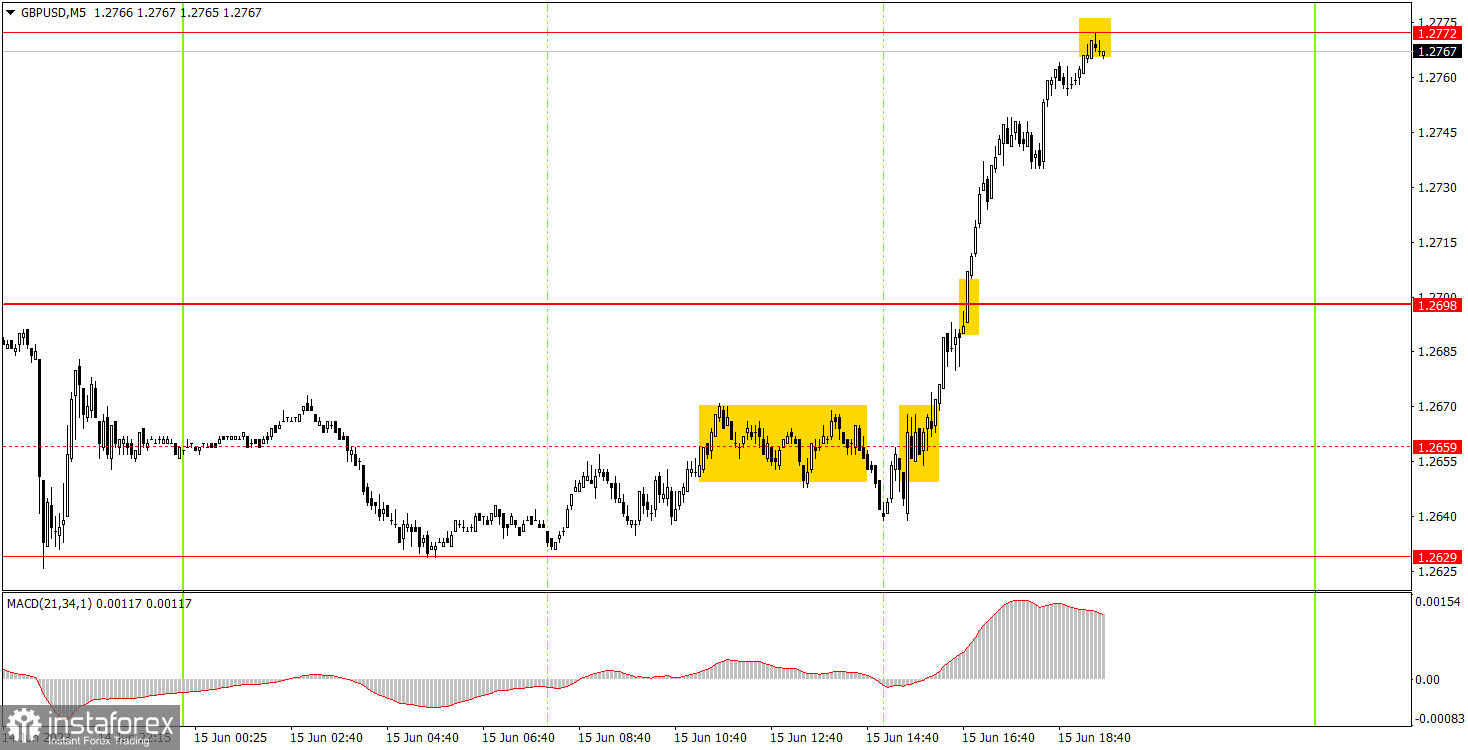
The trading signals on the 5-minute chart were not ideal. The trend only started during the US trading session, while the pair traded quite sluggishly in the morning. Therefore, it is difficult to characterize the first signal around the 1.2659 level. Beginners could have opened short positions at that time, but it was better not to take risks as the signal was very imprecise, and the 1.2659 level was removed from the charts by the end of the day. The next buy signal around the same level was slightly better, so you could have executed this signal using a long position. Later, the pair broke through 1.2698 and grew by about 40 pips. Therefore, the long position could have been manually closed closer to the evening without waiting for a sell signal.
Trading tips on Friday:
On the 30-minute chart, the GBP/USD pair continues its short-term uptrend. The pound had a logical reason behind its growth on Thursday, but it clearly doesn't need any as it continues to rally. There is no point in discussing any logic in the movements right now, as the pound remains heavily overbought. The key levels on the 5M chart are 1.2372, 1.2457, 1.2499, 1.2538, 1.2597, 1.2629, 1.2698, 1.2772, 1.2860. When the price moves in the right direction by 20 pips after opening a trade, a stop loss can be set at breakeven. There are no important events lined up in the UK, while the US will release the University of Michigan Consumer Sentiment Index. Therefore, traders will have little to react to during the day.
Basic trading rules:
1) The strength of the signal depends on the time period during which the signal was formed (a rebound or a break). The shorter this period, the stronger the signal.
2) If two or more trades were opened at some level following false signals, i.e. those signals that did not lead the price to Take Profit level or the nearest target levels, then any consequent signals near this level should be ignored.
3) During the flat trend, any currency pair may form a lot of false signals or do not produce any signals at all. In any case, the flat trend is not the best condition for trading.
4) Trades are opened in the time period between the beginning of the European session and until the middle of the American one when all deals should be closed manually.
5) We can pay attention to the MACD signals in the 30M time frame only if there is good volatility and a definite trend confirmed by a trend line or a trend channel.
6) If two key levels are too close to each other (about 5-15 pips), then this is a support or resistance area.
How to read charts:
Support and Resistance price levels can serve as targets when buying or selling. You can place Take Profit levels near them.
Red lines are channels or trend lines that display the current trend and show which direction is better to trade.
MACD indicator (14,22,3) is a histogram and a signal line showing when it is better to enter the market when they cross. This indicator is better to be used in combination with trend channels or trend lines.
Important speeches and reports that are always reflected in the economic calendars can greatly influence the movement of a currency pair. Therefore, during such events, it is recommended to trade as carefully as possible or exit the market in order to avoid a sharp price reversal against the previous movement.
Beginners should remember that every trade cannot be profitable. The development of a reliable strategy and money management are the key to success in trading over a long period of time.


