


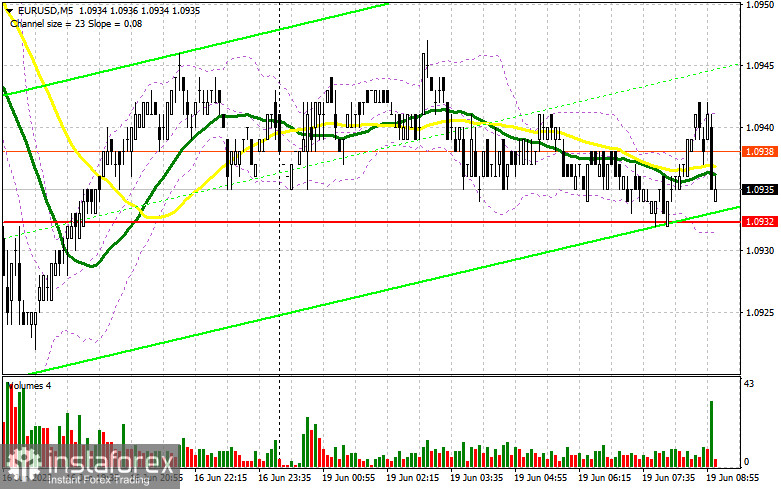
Last Friday, there was only one entry signal. Let's look at the 5-minute chart to get a picture of what happened. Previously, I considered entering the market from the level of 1.0932. A decline and a false breakout through this mark generated a buy signal in continuation of the uptrend. However, the pair only grew by about 20 points. In the second half of the day, there were no entry points
For long positions on EUR/USD:
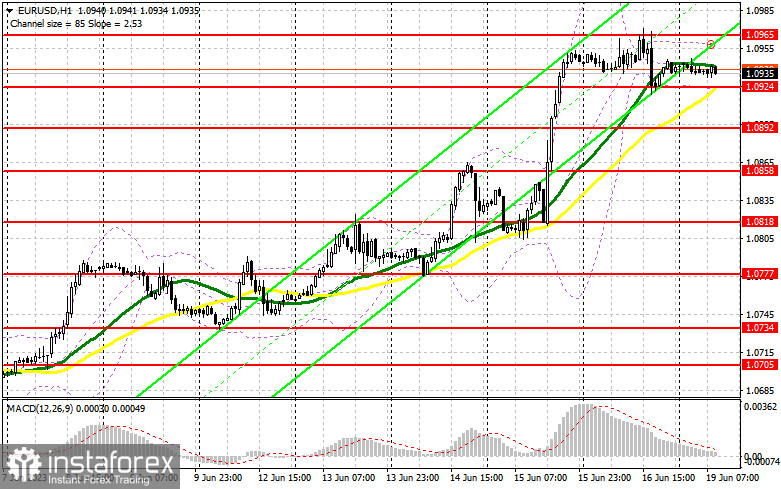
The US dollar regained all its ground after strong results from the US Consumer Sentiment Index on Friday, which jumped to quite a high level in May. Today promises to be a very boring day, as there are no eurozone and US data and the pair is likely to trade in a sideways channel. For this reason, I would advise you to be extremely careful at current levels. I will act around the new support level of 1.0924, which was formed on Friday. A false breakout there could provide an entry point into long positions in continuation of the bullish trend. The pair may aim for the resistance level of 1.0965. A breakout and a downside test of this range will strengthen demand, maintaining its chance to rise to 1.1002, a new resistance. A more distant target will be the 1.10289 level where I recommend locking in profits.
In case EUR/USD falls and the absence of bulls at 1.0924, don't be surprised if the bears are more active, hoping to offset the pair's recent gains. Therefore, only the formation of a false breakout of the next support level of 1.0892 would provide a buy signal for the euro. I will open long positions immediately if EUR/USD bounces off the low at 1.0858, targeting an upward intraday correction of 30-35 pips.
For short positions on EUR/USD:
The bears don't stand much of a chance either. The only thing they can do is protect the new resistance at 1.0965. I will act only on growth and a false breakout around this range. A failed consolidation on this mark will produce a sell signal that can push EUR/USD to 1.0924, the support created by last Friday's results. Only a breakout and an upward retest of this mark can produce a sell signal with a drop to 1.0892. A more distant target will be a low of 1.0858 where I recommend locking in profits.
In case EUR/USD moves up during the European session and there are no bears at 1.0965, bullish sentiment will improve. In that case, I will postpone going short on the pair until it reaches the next resistance level of 1.1002. New short positions can also be opened there, but only after a failed consolidation. I will open short positions immediately if EUR/USD bounces off the high of 1.1029, targeting a downward correction of 30-35 pips.
COT report:
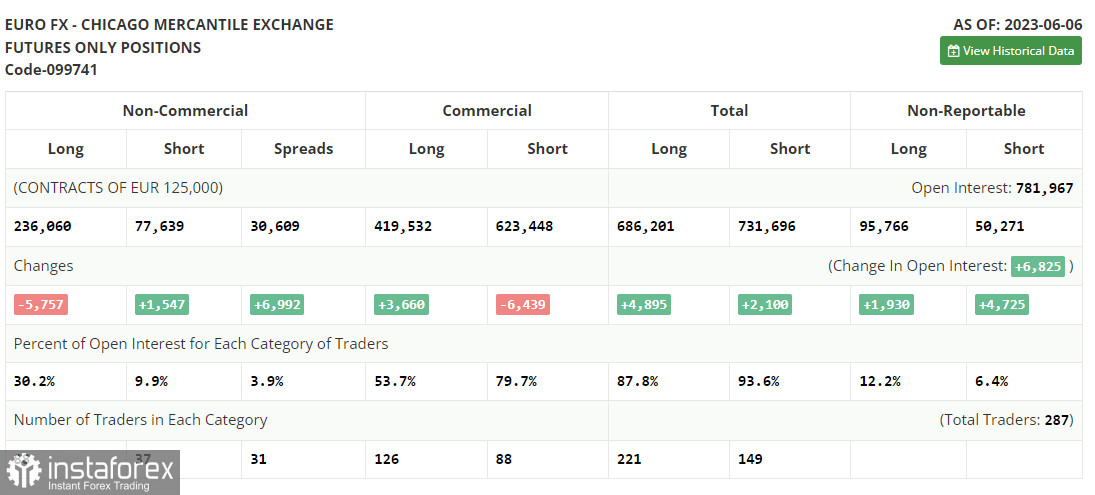
The COT report for June 6 revealed a fall in long positions and a slight increase in short positions. The decision of the Federal Reserve on interest rates this week can significantly change the situation in the market. If the Federal Reserve decides to pause hiking rates, the euro will gain significantly while the US dollar will weaken. With an aggressive European Central Bank and despite the signs of a slowdown in underlying inflationary pressures, risk assets will likely continue strengthening against the US dollar. According to the COT report, non-commercial long positions decreased by 5,757 to 236,060, while non-commercial short positions increased by 1,457 to 77,060. The overall non-commercial net position dropped to 158,224 from 163,054. The weekly closing price fell to 1.0702 from 1.0732.
Indicator signals:
Moving Averages
Trading is carried out above the 30 and 50-day moving averages, which indicates the pair's growth.
Please note that the time period and levels of the moving averages are analyzed only for the H1 chart, which differs from the general definition of the classic daily moving averages on the D1 chart.
Bollinger Bands
If the pair falls, the lower band of the indicator at 1.0935 will act as support.
Description of indicators:
• A moving average of a 50-day period determines the current trend by smoothing volatility and noise; marked in yellow on the chart;
• A moving average of a 30-day period determines the current trend by smoothing volatility and noise; marked in green on the chart;
• MACD Indicator (Moving Average Convergence/Divergence) Fast EMA with a 12-day period; Slow EMA with a 26-day period. SMA with a 9-day period;
• Bollinger Bands: 20-day period;
• Non-commercial traders are speculators such as individual traders, hedge funds, and large institutions who use the futures market for speculative purposes and meet certain requirements;
• Long non-commercial positions represent the total number of long positions opened by non-commercial traders;
• Short non-commercial positions represent the total number of short positions opened by non-commercial traders;
• The non-commercial net position is the difference between short and long positions of non-commercial traders.


