


The hawkish rhetoric of officials from the Fed, ECB, and Bank of England (on Thursday, the leaders of the Bank of England raised interest rates by 0.50% to 5.00%) regarding the prospects of these central banks' policies continues to put pressure on the precious metal.
Yesterday, the XAU/USD pair reached a 13-week low, dropping to the level of 1920.00. At the beginning of the U.S. trading session on Thursday, XAU/USD is trading near the 1929.00 level, showing a tendency for further decline within the downward channel on the daily chart towards its lower boundary and key support levels of 1916.00 (144 EMA on the daily chart) and 1896.00 (61.8% Fibonacci level in the downward correction wave from its peak at 2070.00 to its low at 1615.00 and 200 EMA on the daily chart).
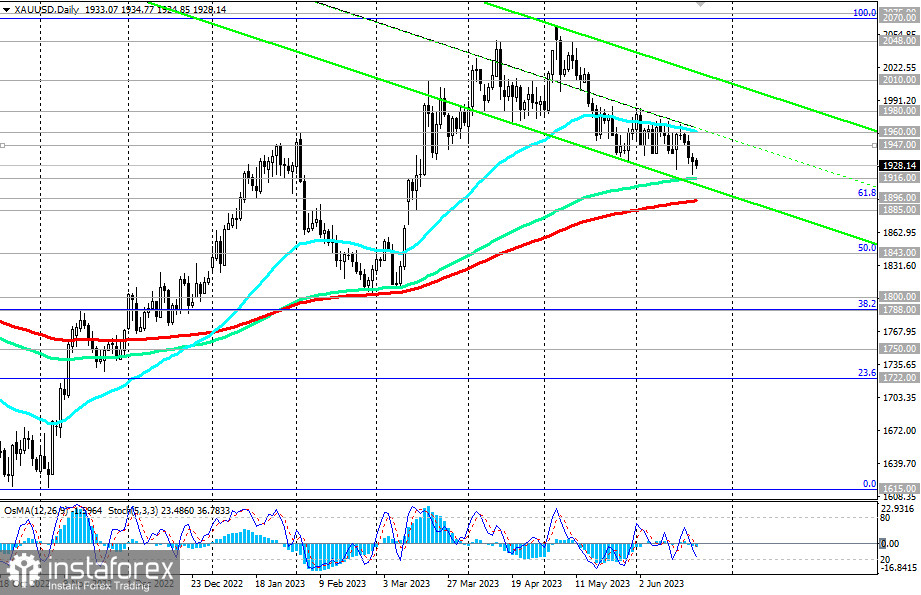
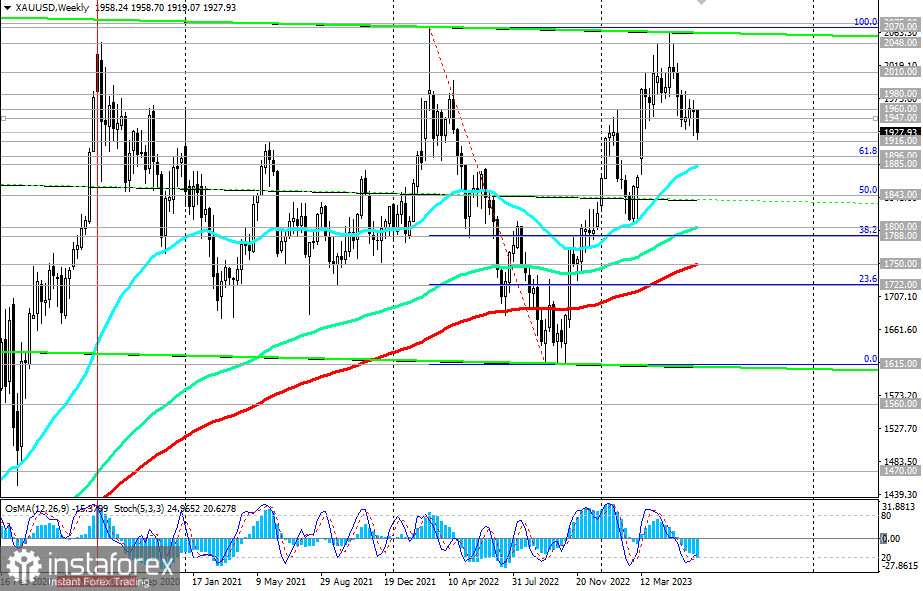
A break of these levels and the 1885.00 support level (50 EMA on the weekly chart) will pave the way for a deeper decline towards the key long-term support levels of 1800.00 (200 EMA on the weekly chart), 1788.00 (38.2% Fibonacci level), 1750.00 (200 EMA on the weekly chart), 1722.00 (23.6% Fibonacci level), separating the long-term bullish trend of gold from the bearish trend.
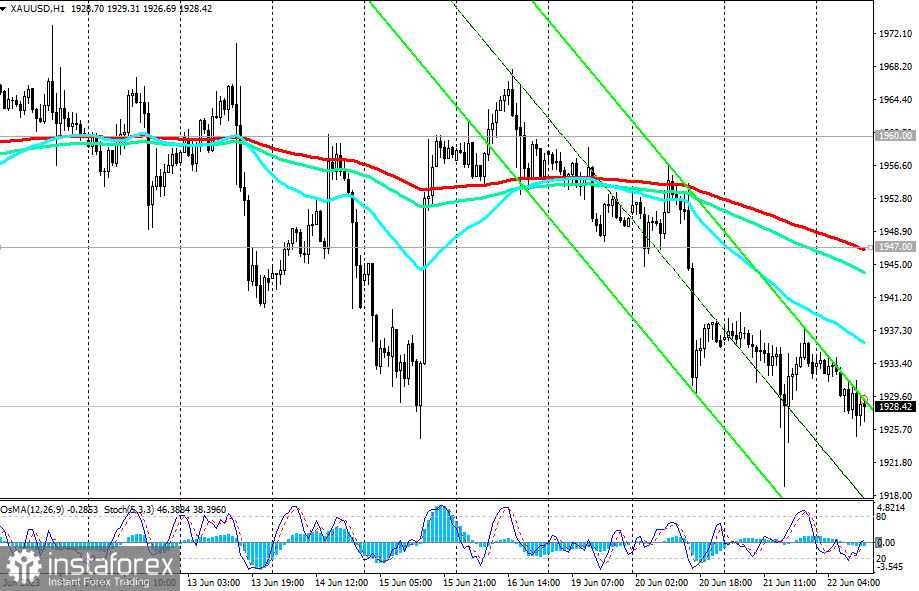
In an alternative scenario, breaking through the nearest and short-term resistance level at 1936.00 (200 EMA on the 15-minute chart and local resistance level) will be the first and quickest signal for a resumption of long positions, while a breakout of resistance levels at 1960.00 (200 EMA on the 4-hour chart, 50 EMA on the daily chart) and 1980.00 (local resistance level) will confirm the bullish trend.
In this case, the upside targets are near the resistance levels of 2000.00, 2048.00, and 2070.00.
Support levels: 1916.00, 1900.00, 1896.00, 1885.00, 1843.00, 1800.00, 1788.00, 1750.00
Resistance levels: 1936.00, 1947.00, 1960.00, 1980.00, 2000.00, 2010.00, 2048.00, 2070.00


