When to open long positions on GBP/USD:
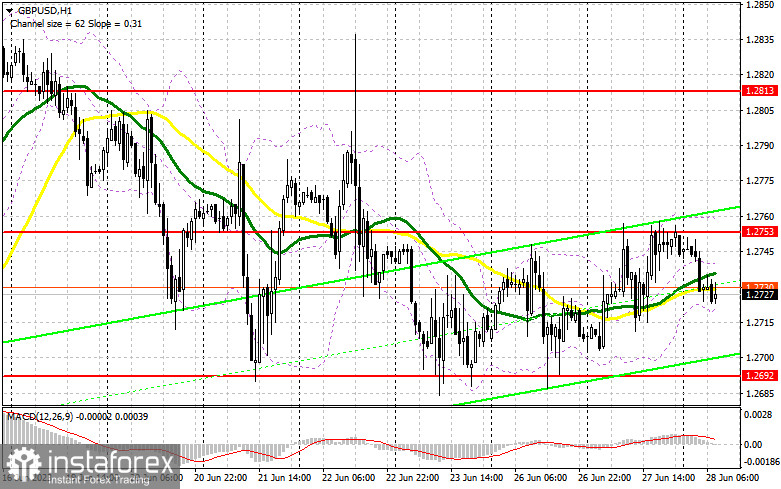
The pair's gradual reversal, which is clearly visible on the hourly chart, suggests a high likelihood of the GBP/USD downtrend correction nearing completion, with potential for an upward surge. However, settling above 1.2753 or at the very least 1.2692 is crucial. Trading is carried out near the moving averages, which indicates market uncertainty regarding the pair's trajectory. With no major events on the calendar except Bank of England Governor Andrew Bailey's speech, the pound sterling maintains its chances for further upside momentum.

Bulls remain focused on the support level at 1.2692, eagerly awaiting a false breakout and a buy signal for GBP/USD. In such a scenario, the midpoint of the sideways channel at 1.2753 becomes the target for recovery, a level that has eluded bulls for several days. Bullish traders need to hold on to this level as breaking through and establishing a foothold above it would generate an additional buy signal, paving the way for a surge towards 1.2813. The most distant target lies at 1.2876, where I will take profit.
If GBP/USD declines towards 1.2692 and there is no significant activity of bullish traders, downward pressure on the pound would intensify, leading to a more substantial downside move towards 1.2625 and a potential retest of the weekly low. Safeguarding this area, along with a false breakout, would provide a signal for opening long positions. I plan to buy GBP/USD immediately if it rebounds from 1.2574, targeting an intraday correction of 30-35 pips, although reaching that level seems unlikely.
When to open short positions on GBP/USD:
Bears achieved their objectives yesterday, and their primary goal now is to prevent the pound sterling from surpassing 1.2753, a level that could witness an early-day surge. A false breakout of this level would trigger a selling signal, renewing downward pressure on the pair and aiming for another test of 1.2692. A breakout and subsequent upward retest would deal a more severe blow to the positions of bulls, potentially pushing GBP/USD towards 1.2625. The most distant target remains at 1.2574, where I will take profits.
If GBP/USD experiences an upside scenario and no significant action occurs at 1.2753, signaling the end of another attempted downward correction, bulls would regain control. In such a case, I would postpone opening short positions until the pair tests the resistance at 1.2813. A false breakout there would provide an entry point for short positions. If downward movement fails to materialize I would consider opening short positions on GBP/USD if it rebounds from 1.2876, expecting an intraday correction of 30-35 pips.
Commitment of Traders (COT) report:
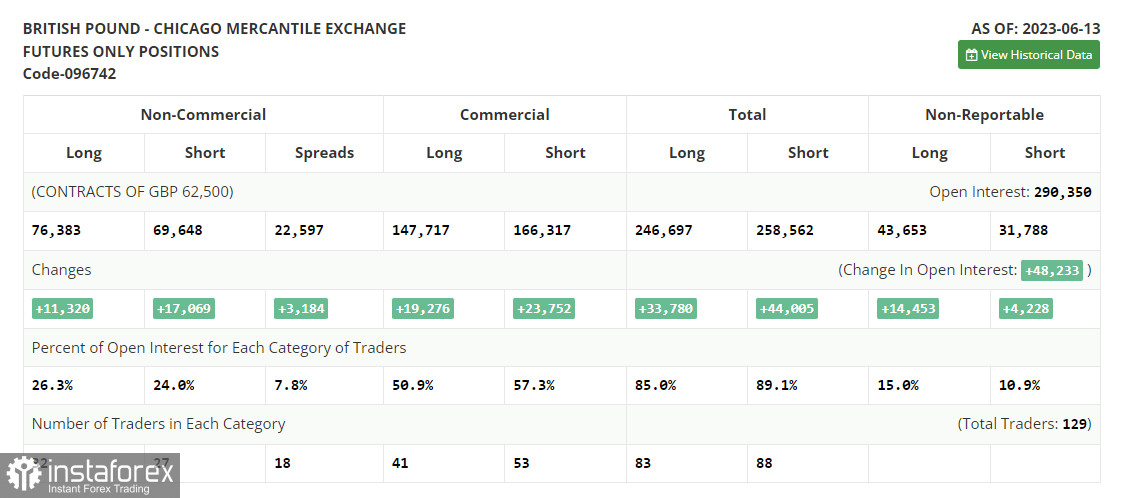
The Commitment of Traders (COT) report for June 13 showed that both long and short positions increased sharply. The pound sterling has risen significantly recently, attracting the attention of bears. However, the aggressive policy of the Bank of England and the latest inflation data in the UK are bringing new bulls into the market, who are expecting further interest rate hikes. The fact that the Federal Reserve has paused its tightening cycle while the Bank of England has no plans to do so makes GBP quite attractive. The latest COT report states that short non-commercial positions increased by 17,069 to 69,648, while long non-commercial positions jumped by 11,320 to 76,383. The non-commercial net position decreased to 6,736 from 12,454 in the previous week. The weekly price rose to 1.2605 from 1.2434.

Indicator signals:
Moving Averages
GBP/USD is currently trading near the 30-day and 50-day moving averages, indicating a sideways market.
Note: The author uses hourly chart (H1) parameters and prices for the moving averages, which differ from the traditional definition of daily moving averages on the daily chart (D1).
Bollinger Bands
If GBP/USD declines, the lower boundary of the indicator around 1.2725 will provide support.
Description of indicators
Moving average (moving average, determines the current trend by smoothing out volatility and noise). Period 50. It is marked yellow on the chart. Moving average (moving average, determines the current trend by smoothing out volatility and noise). Period 30. It is marked green on the chart. MACD indicator (Moving Average Convergence/Divergence - convergence/divergence of moving averages) Quick EMA period 12. Slow EMA period to 26. SMA period 9 Bollinger Bands (Bollinger Bands). Period 20 Non-commercial speculative traders, such as individual traders, hedge funds, and large institutions that use the futures market for speculative purposes and meet certain requirements. Long non-commercial positions represent the total long open position of non-commercial traders. Short non-commercial positions represent the total short open position of non-commercial traders. Total non-commercial net position is the difference between the short and long positions of non-commercial traders.


