June 28 macroeconomic calendar
In a speech at the ECB forum yesterday, Federal Reserve Chairman Jerome Powell said that he did not rule out the possibility of more rate hikes at the coming meetings and confirmed that Fed policymakers mostly favored two more rate hikes this year.
His remarks became the main driving force for the greenback in financial markets.
Overview of trading charts on June 28
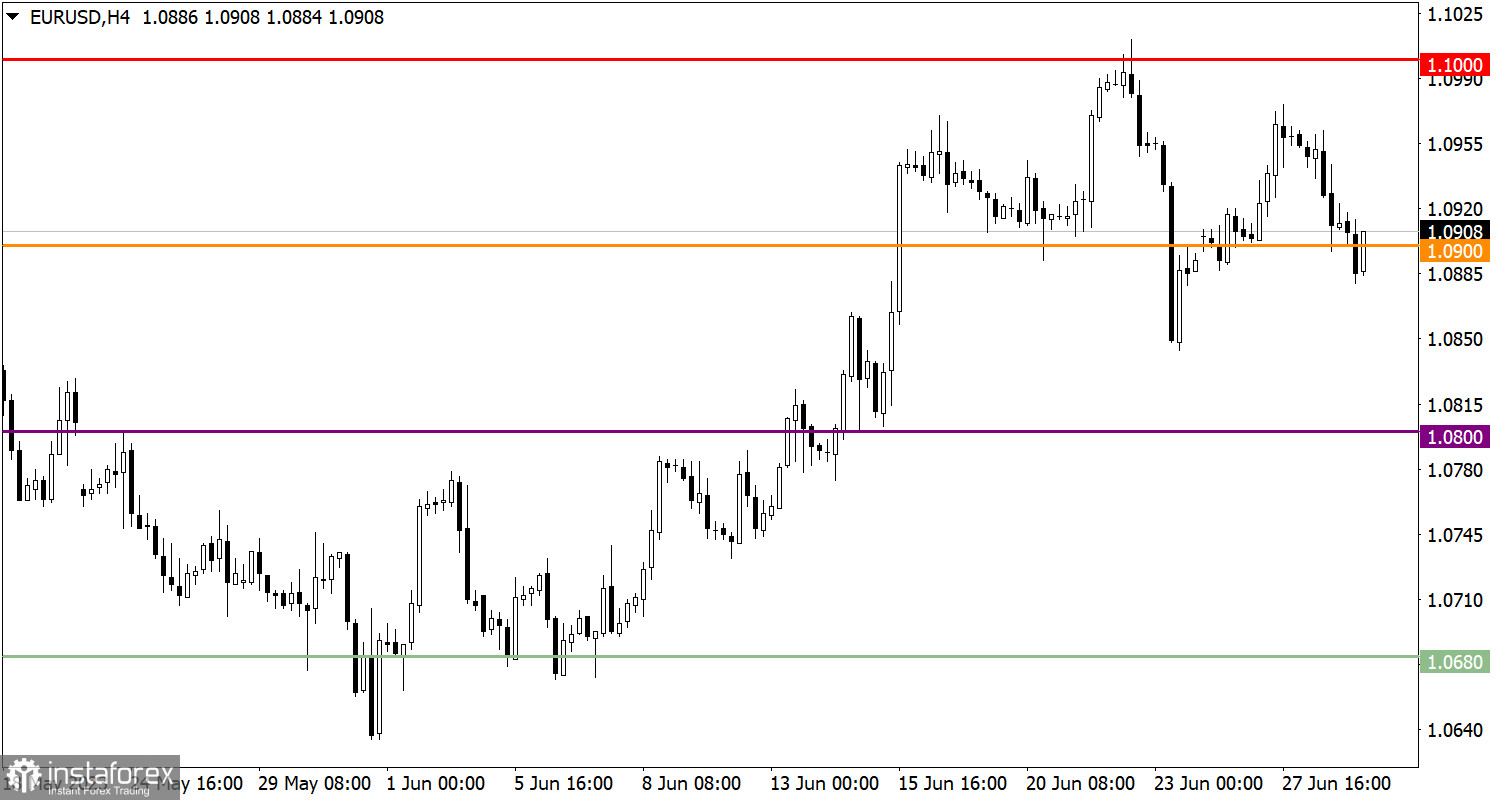
In the course of a bear run, the euro/dollar pair dropped below 1.0900. That move indicated a continuing correction from the 1.1000 level.
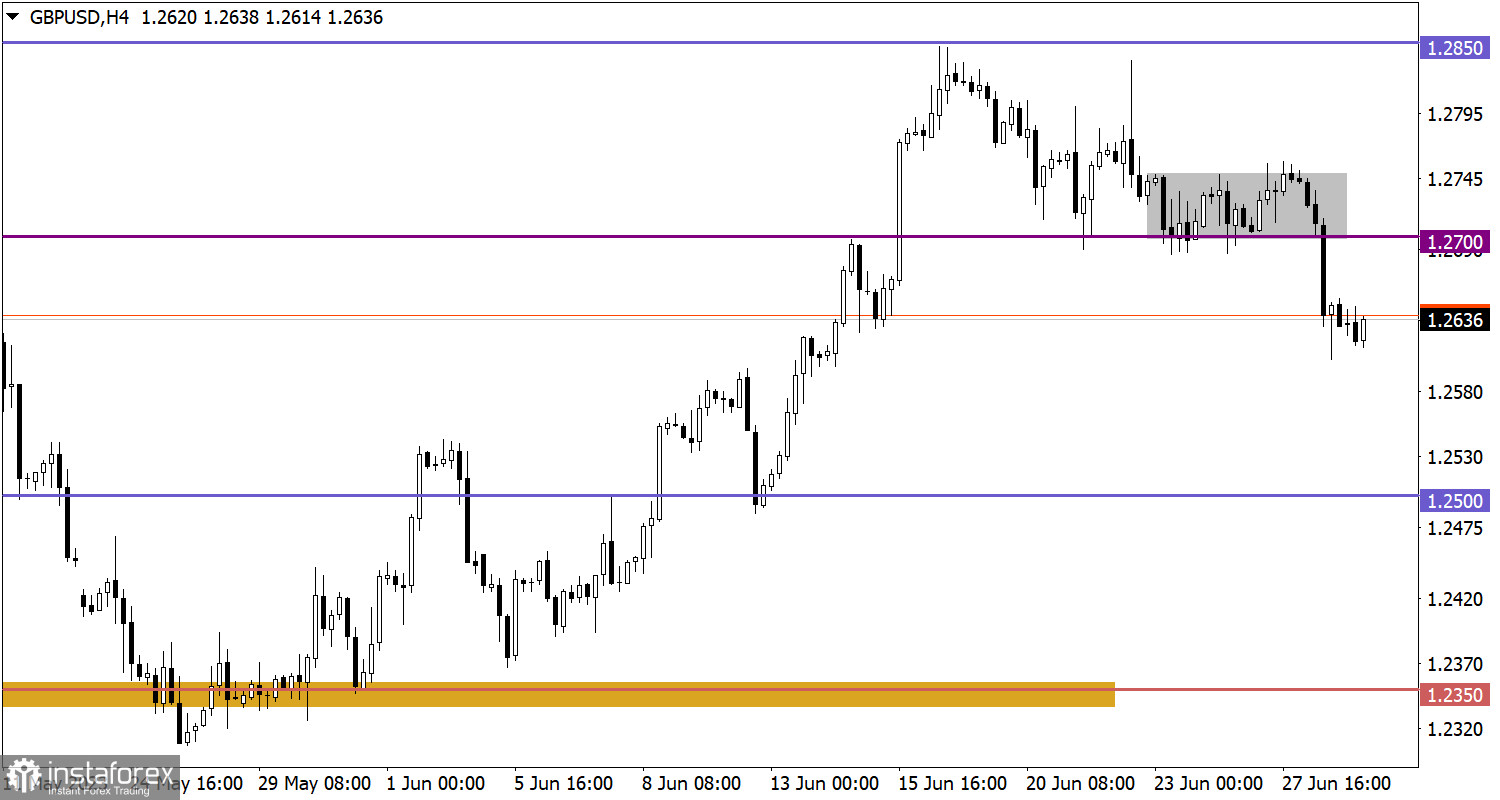
The pound/dollar pair ended its 3-day sideways movements in the range of 1.2700/1.2750 by breaking through its lower limit. That triggered an increase in selling volumes as well as bearish momentum.

June 29 macroeconomic calendar
Today, the US will see the release of its weekly jobless claims data. Figures are projected to grow. Continuing claims are forecast to rise to 1,765,000 from 1,759,000 while initial ones are likely to rise to 265,000 versus 264,000.
Trading plan for EUR/USD on June 29
The pair may trade horizontally for a while or bounce due to a sharp price change the day before. Should quotes stay firm below 1.0900, we would see a fall in value.

Trading plan for GBP/USD on June 29
Due to a sharp price change in the market, an oversold signal could be generated, which would mean that the pair could come to a standstill or bounce. However, should speculators not respond to technical signals, the price would fall to 1.2550.

What's on chart
The candlestick chart shows graphical white and black rectangles with upward and downward lines. While conducting a detailed analysis of each individual candlestick, it is possible to notice its features intrinsic to a particular time frame: the opening price, the closing price, and the highest and lowest price.
Horizontal levels are price levels, in relation to which a stop or reversal of the price may occur. They are called support and resistance levels.
Circles and rectangles are highlighted examples where the price reversed in the course of its history. This color highlighting indicates horizontal lines which can exert pressure on prices in the future.
Upward/downward arrows signal a possible future price direction.


