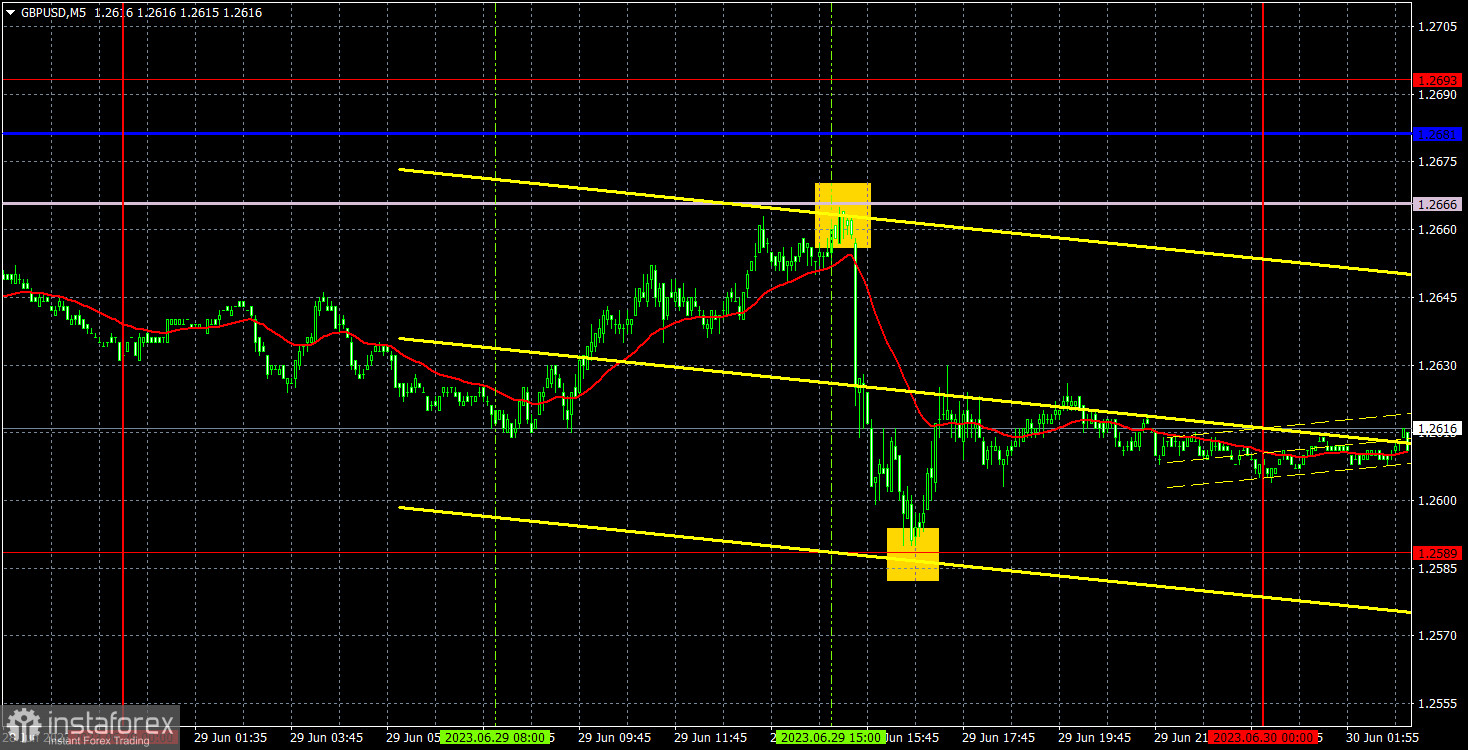
5M chart of GBP/USD

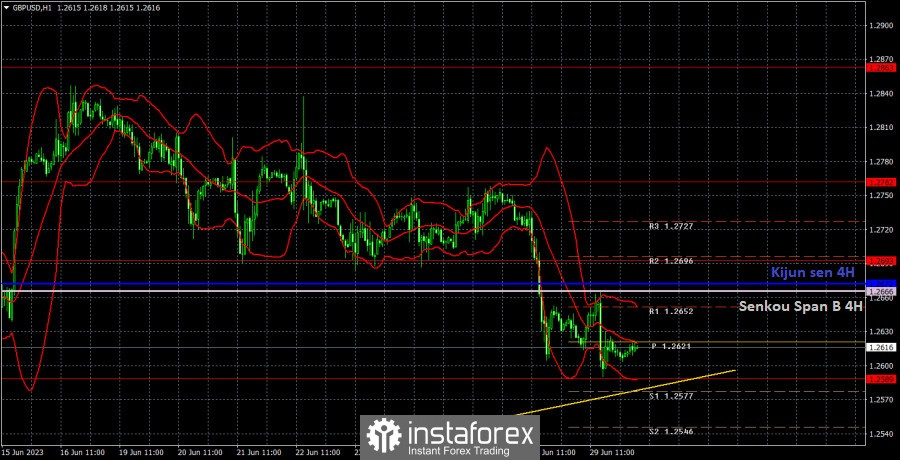
On Thursday, the GBPUSD pair also showed some bearish bias move, which was justified by a stronger-than-expected US GDP report. In the first half of the day, both the pound and the euro recovered from the losses of the previous day. The pair is currently below the Ichimoku indicator lines and has approached the ascending trendline on the hourly chart. Thus, the pound's fate in the near term will be decided soon. We expect the pound to fall further as we believe that the market has had enough time to price in all of the Bank of England's aggressive monetary policy. However, the uptrend may persist for some time, as we have been expecting a strong decline for several months now. Take note that the market is not obliged to trade in line with the fundamental background. There are major players who conduct currency transactions for their own purposes, either buying or selling.
There were only two entry points yesterday. First, the pair bounced off the Senkou Span B line (approximately at the time of the US GDP report), and then from the 1.2589 level. The short position yielded about 60 pips of profit, but it was quite risky. The long position gave traders the chance to earn an additional 20 pips. The lines and levels worked perfectly yesterday.
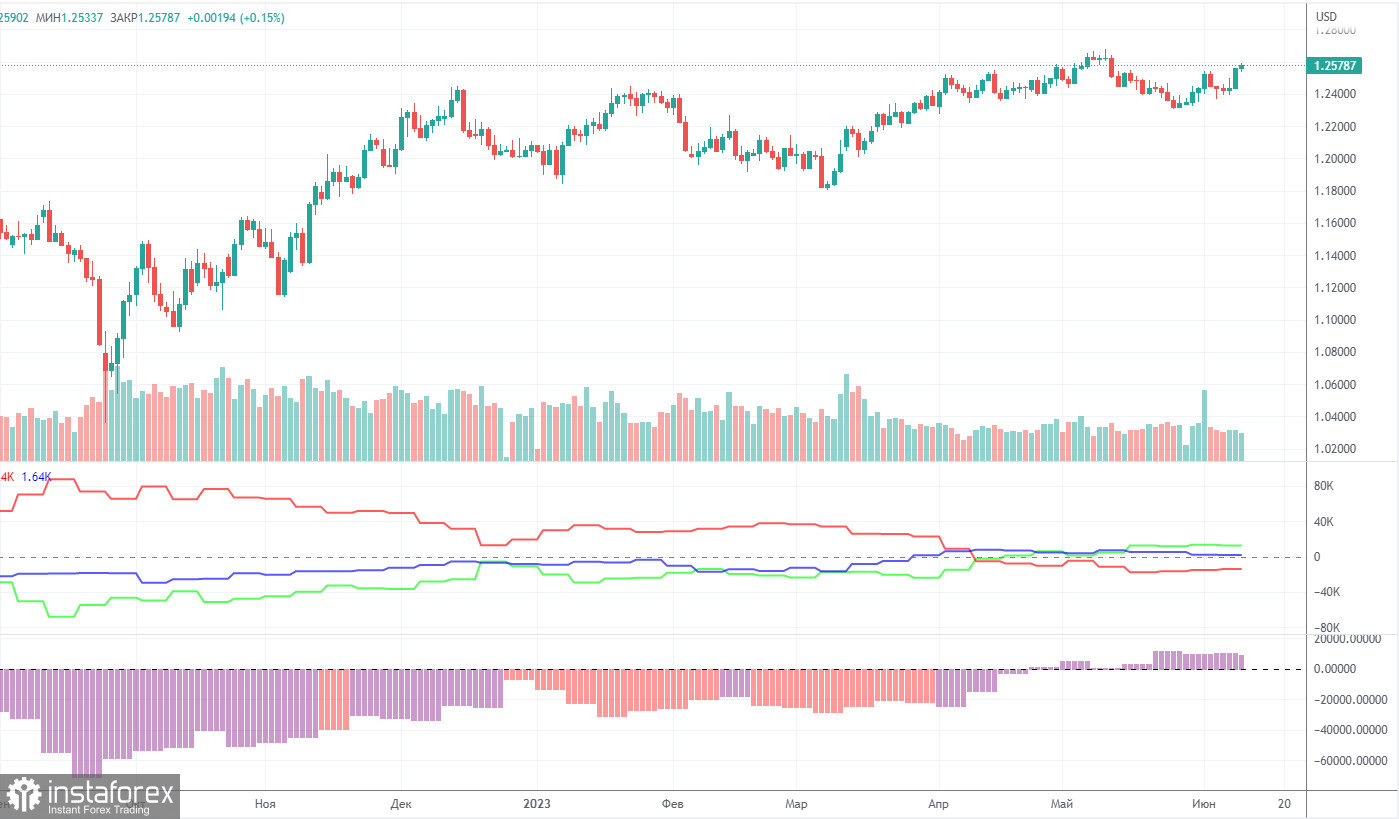
COT report:

According to the latest report, non-commercial traders opened 25,100 long positions and closed 14,600 short ones. The net position increased by 39,700 in just a week and continues to grow. Over the past 9-10 months, the net position has been on the rise. We are approaching a point where the net position has grown too much to expect further growth. We assume that a prolonged bear run may soon begin, even though COT reports suggest a bullish continuation. It is becoming increasingly difficult to believe in it with each passing day. We can hardly explain why the uptrend should go on. However, there are currently no technical sell signals.
The pound has gained about 2,500 pips. Therefore, a bearish correction is now needed. Otherwise, a bullish continuation would make no sense. Overall, non-commercial traders hold 54,900 sell positions and 101,500 long ones. Such a gap suggests the end of the uptrend. We do not see the pair extending growth in the long term.
1H chart of GBP/USD

In the 1-hour chart, GBP/USD maintains a bullish bias, although it is correcting at the moment. The ascending trend line serves as a buy signal. However, we still believe that the British currency is overvalued and should fall in the medium term. The fundamental backdrop for the pound is getting weaker. The dollar also lacks a fundamental advantage but has already lost 2,500 pips over the past 10 months and requires a correction.
On June 30, trading levels are seen at 1.2349, 1.2429-1.2445, 1.2520, 1.2589, 1.2693, 1.2762, 1.2863, 1.2981-1.2987. The Senkou Span B line (1.2666) and the Kijun-sen (1.2672) may also generate signals when the price either breaks or bounces off them. A Stop Loss should be placed at the breakeven point when the price goes 20 pips in the right direction. Ichimoku indicator lines can move intraday, which should be taken into account when determining trading signals. There are also support and resistance which can be used for locking in profits.
On Friday, the UK will release the GDP report for the first quarter, while the US will have only a few secondary reports, including the University of Michigan's consumer sentiment index. We do not expect any surprises from the GDP report, but it's still possible for the data to provide surprises as the Bank of England's interest rate continues to rise, and the US GDP has surprised with its strong value.
Indicators on charts:
Resistance/support - thick red lines, near which the trend may stop. They do not make trading signals.
The Kijun-sen and Senkou Span B lines are the Ichimoku indicator lines moved to the hourly timeframe from the 4-hour timeframe. They are also strong lines.
Extreme levels are thin red lines, from which the price used to bounce earlier. They can produce trading signals.
Yellow lines are trend lines, trend channels, and other technical patterns.
Indicator 1 on the COT chart is the size of the net position of each trader category.
Indicator 2 on the COT chart is the size of the net position for the Non-commercial group of traders.


