


EUR/USD didn't show significant movements on Monday. As usual, it was a rather uneventful day marked by low volatility. However, the macroeconomic backdrop had an impact on market sentiment as practically all of the reports missed their forecasts. Business activity in Germany, the United States, and the eurozone declined compared to the previous month, which could have led to a drop in the euro in the first half of the day and a fall in the greenback in the second half. However, it should be noted that all indices, except for the US ISM data, were released in their second estimates. In other words, traders knew what to expect. Anyway, the macroeconomic backdrop seemed to have only a small influence on the pair.
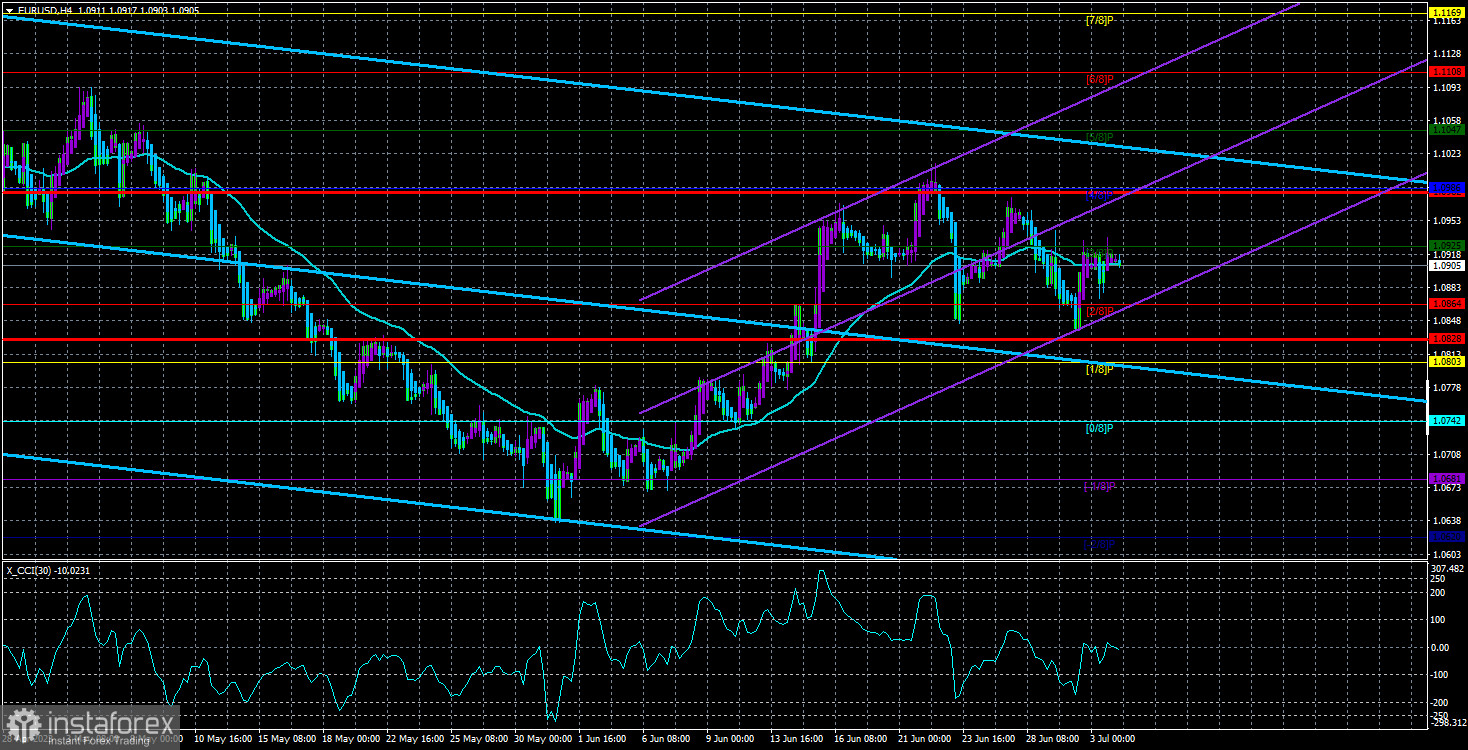
In the 4-hour time frame, the pair is clearly in line with the Moving Average, indicating a flat market in the short term. On Tuesday, the situation is unlikely to change drastically as it is Independence Day in the US, and all trading platforms and banks will be closed. Therefore, we should not expect any strong movements today. Moreover, volatility is likely to be low, especially in the second half of the day. Additionally, there won't be any significant fundamental or macroeconomic events today, so even if traders wanted to trade, they would lack triggers and drivers.
Therefore, we are in for a very calm trading day. The pair may remain flat, and its future prospects are unclear. EUR/USD has been within the range of 1.05-1.11 for the past six months, and it will unlikely leave this range in the near future.
Raphael Bostic not in hurry to raise rates
In recent weeks, members of the US Federal Reserve and the European Central Bank have been quite busy. They have delivered a series of speeches and have shed some light on the future changes in their monetary policies. The Fed says there could be two more rate hikes. The ECB allows for several rate hikes as inflation is still far from the target level. In any case, both scenarios imply a continuation of tightening.
At the end of last week, Atlanta Fed President Raphael Bostic gave another interview where he stated that he was not in a hurry to raise rates. "Policy has been restrictive for only eight to nine months. Therefore, the real economic effects of tighter monetary policy are only just beginning to take hold," Bostic said. "What we don't know is exactly how responsive our brakes are, how quickly policy will bite more deeply and in turn how quickly inflation will fall."
He also stated that if inflation stops declining or goes down slowly, the regulator will consider a scenario with more tightening. Bostic also stated that there could be no more than two rate hikes. If the Fed continues to observe signs of a slowdown in inflation, the second rate hike may not be necessary.
As we can see, the end of the Federal Reserve's tightening cycle is nearing, but the rate remains quite high. The ECB may raise rates more in 2023, but its rate will still be lower than that of the Federal Reserve. We do believe that there are no reasons to expect further growth in the euro.
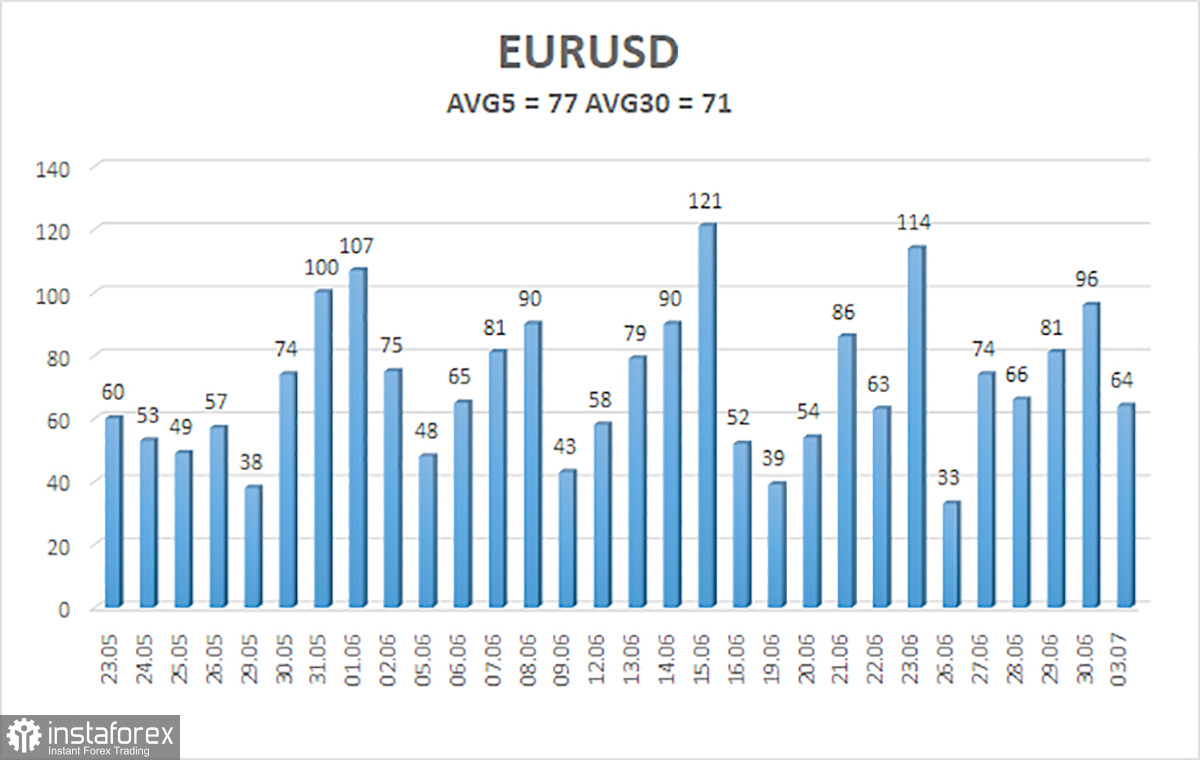
The 5-day average volatility of EUR/USD totals 77 pips on July 4 and is considered moderate. We anticipate the price to be in the range between 1.0828 and 1.0982 on Tuesday. The Heiken Ashi's reversal to the downside will indicate a resumption of the downtrend.
Support:
S1 – 1.0864
S2 – 1.0803
S3 – 1.0742
Resistance:
R1 – 1.0925
R2 – 1.0986
R3 – 1.1047
Outlook:
EUR/USD is at a standstill at the beginning of the week. Therefore, we can sell with targets at 1.0828 and 1.0803 when the price is below the MA. Once the price consolidates above the Murray 3/8 at 1.0925, we can consider buying with targets at 1.0982 and 1.0986.
Indicators on charts:
Linear Regression Channels help identify the current trend. If both channels move in the same direction, a trend is strong.
Moving Average (20-day, smoothed) defines the short-term and current trends.
Murray levels are target levels for trends and corrections.
Volatility levels (red lines) reflect a possible price channel the pair is likely to trade in within the day based on the current volatility indicators.
CCI indicator. When the indicator is in the oversold zone (below 250) or in the overbought area (above 250), it means that a trend reversal is likely to occur soon.


