Details of the economic calendar on July 3
The main event on Monday was the publication of data on business activity indices in Europe, the UK, and the U.S. According to the PMI statistical indicators, the business activity index in the EU's manufacturing sector dropped from 44.8 to 43.4 points, which turned out to be lower than the expected level of 43.6 points. In the UK, the index in the manufacturing sector also fell from 47.1 to 46.5, but exceeded the forecast of 46.2. While United States manufacturing PMI fell from 48.4 to 46.3, matching the forecast.
The reaction to the statistical data package appeared as variable fluctuations on the trading charts.

Analysis of trading charts from July 3
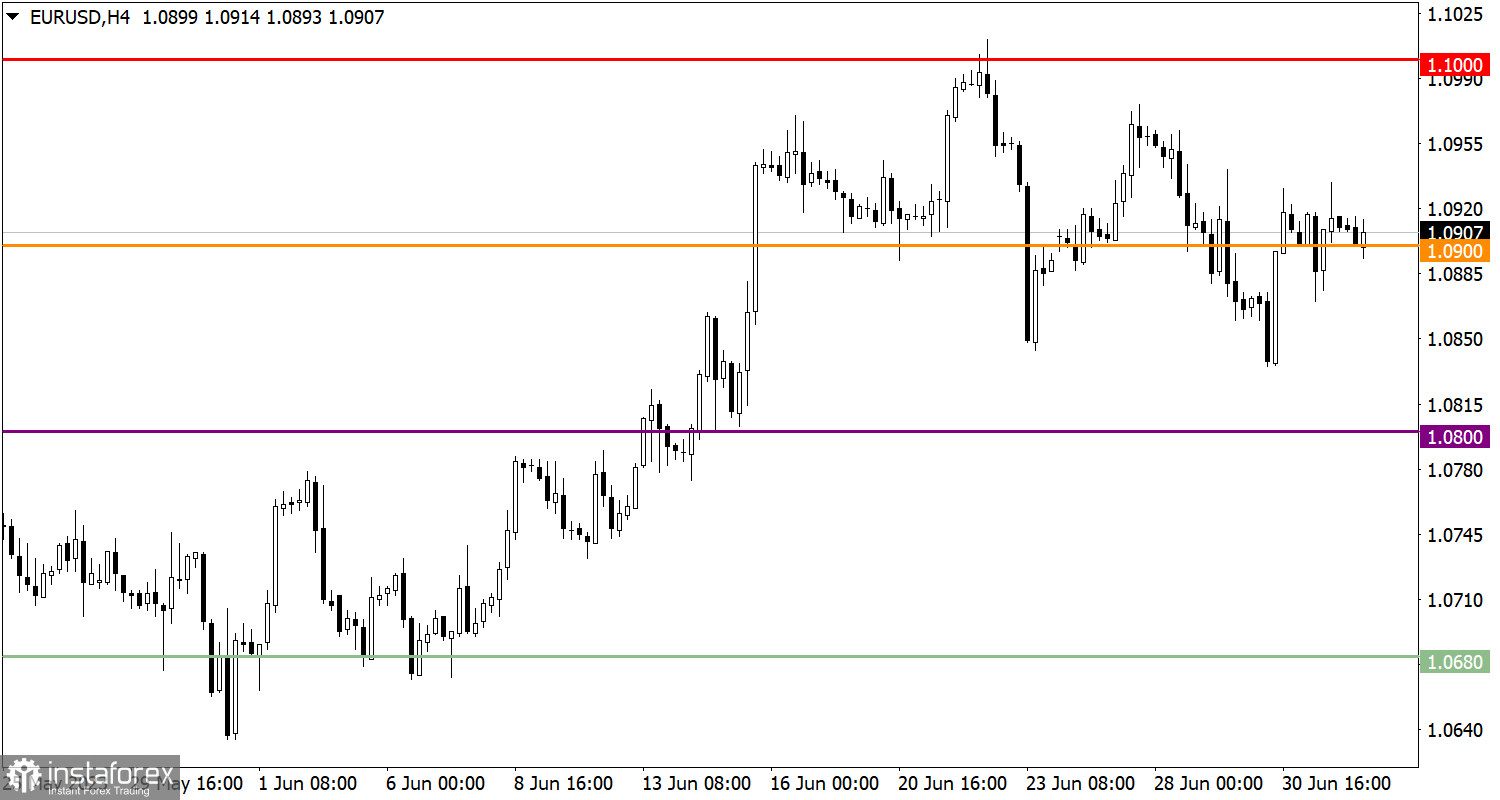
The EUR/USD currency pair is currently in a stalemate around the value of 1.0900. This fluctuation has led to a reduction in the volume of long positions, which significantly increased last Friday.
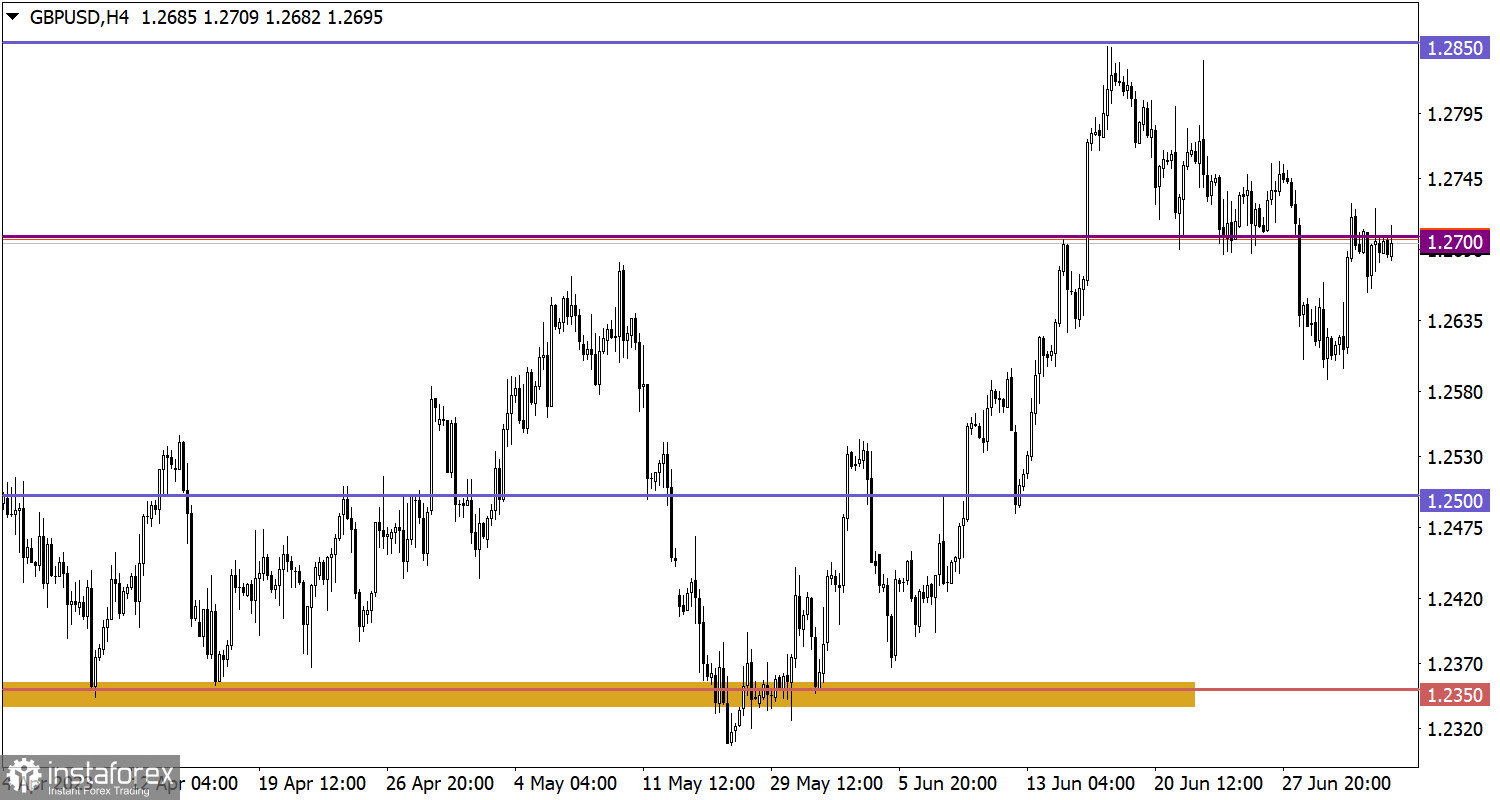
The GBP/USD pair approached the 1.2700 resistance level, which led to a slowdown in the upward cycle. The process of price recovery after the recent corrective movement has temporarily halted.
Economic calendar for July 4
Today's calendar lacks significant macroeconomic events, and furthermore, it's a public holiday in the United States due to Independence Day. In light of this, a decrease in trading volumes is expected, which may lead to a reduction in market volatility.
EUR/USD trading plan for July 4
In this situation, a subsequent amplitude course along the 1.0900 level is possible due to the absence of a major player in the market. However, if there is a stable holding of the price below the value of 1.0880, a gradual increase in the volume of short positions, which allows for a subsequent decrease in the euro exchange rate, is not ruled out.

GBP/USD trading plan for July 4
To continue the growth of the volume of long positions, it is necessary for the quote to hold above the level of 1.2750. In this case, the next stage of recovery of the pound sterling's value after the recent corrective movement may arise.
As for a possible subsequent downward movement, a return of the price below the level of 1.2650 could lead to the activation of short positions. This step will lead to an update of the local low of the corrective cycle.

What's on the charts
The candlestick chart type is white and black graphic rectangles with lines above and below. With a detailed analysis of each individual candle, you can see its characteristics relative to a particular time frame: opening price, closing price, intraday high and low.
Horizontal levels are price coordinates, relative to which a price may stop or reverse its trajectory. In the market, these levels are called support and resistance.
Circles and rectangles are highlighted examples where the price reversed in history. This color highlighting indicates horizontal lines that may put pressure on the asset's price in the future.
The up/down arrows are landmarks of the possible price direction in the future.


