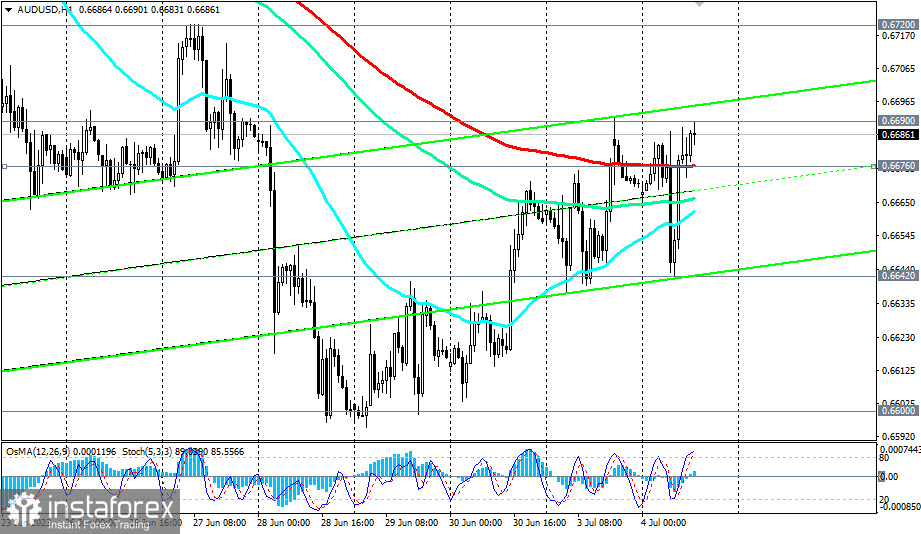
The Australian dollar reacted negatively to the unexpected decision of the RBA to leave the interest rate at the current level of 4.10%. Immediately after the publication of the RBA's decision, the Australian dollar sharply declined, and the AUD/USD pair lost almost 50 points, dropping to the intraday low of 0.6642.
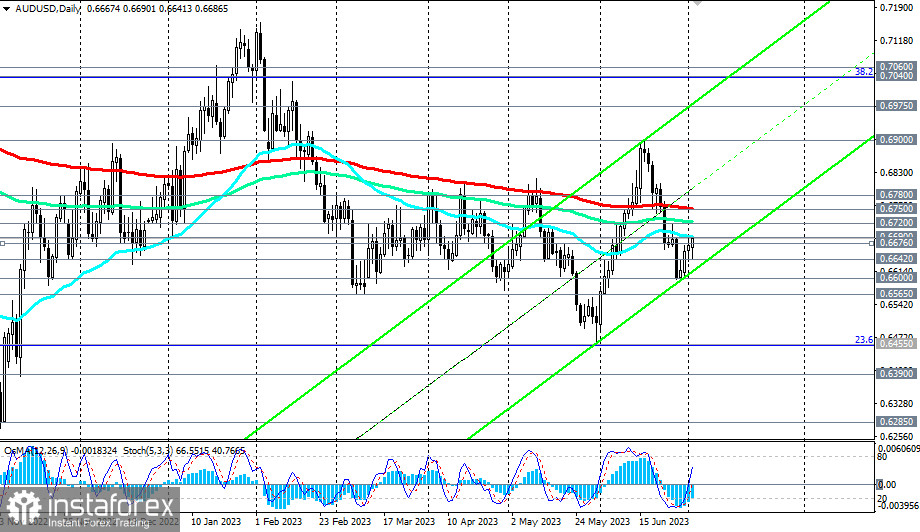
As of writing, the AUD/USD pair was in the range between important short-term levels: support at 0.6676 (200 EMA on the 1-hour chart) and resistance at 0.6690 (200 EMA on the 4-hour chart, 50 EMA on the daily chart). A break in either direction could determine the direction of further price movement.

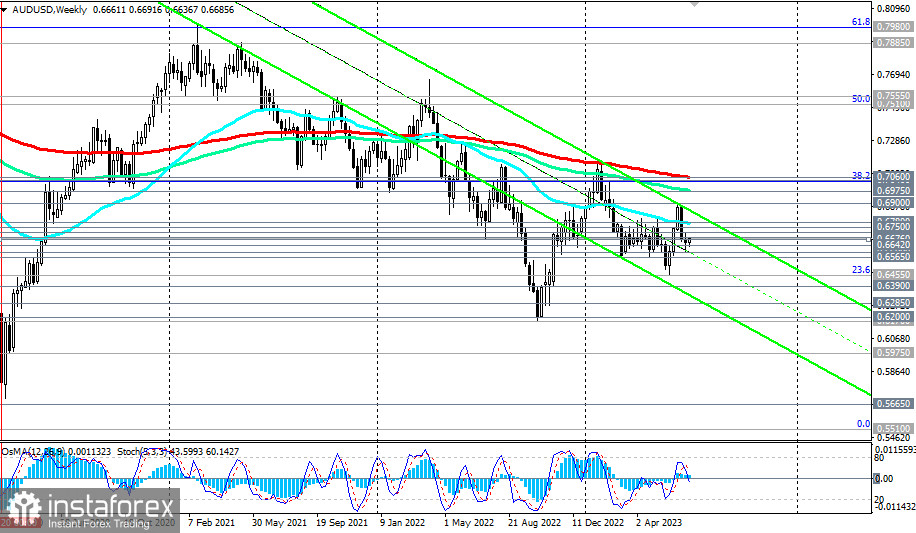
In the first case, after breaking through the support levels of 0.6676, 0.6642 (today's low), AUD/USD will head inside the downward channel on the weekly chart, towards its lower boundary, currently near local lows (from April 2020) and marks of 0.6200, 0.6285.
The "fastest" signal to implement a downward scenario is a break below the level of 0.6664 (today's opening and 200 EMA on the 15-minute chart).

AUD/USD is below the key resistance levels of 0.7060 (200 EMA on the weekly chart), 0.7040 (50 EMA on the monthly chart and 38.2% Fibonacci retracement of the decline wave from 0.9500 to 0.5510), remaining in the long-term bear market zone, and below key resistance levels of 0.6750 (200 EMA on the daily chart), 0.6720 (144 EMA on the daily chart) in the medium-term bear market zone, which makes short positions preferable in the current situation.
However, technical indicators OsMA and Stochastic on the daily chart have turned to long positions, signaling the possibility of an alternative scenario for AUD/USD growth.
In this case, a breakout of the resistance levels of 0.6690, 0.6700 could signal the resumption of long positions, with targets at the resistance levels 0.6720, 0.6750, 0.6780 (50 EMA on the weekly chart).
Their breakout will open the way for further growth to the key resistance levels of 0.6975 (144 EMA on the weekly chart), 0.7040, 0.7060, separating the long-term bear market from the bull market.
Support levels: 0.6676, 0.6665, 0.6642, 0.6600 , 0.6565, 0.6500, 0.6455, 0.6390, 0.6285, 0.6200, 0.6170
Resistance levels: 0.6690, 0.6700, 0.6720, 0.6750, 0.6780, 0.6800, 0.6900, 0.6975, 0.7000, 0.7040, 0.7060


