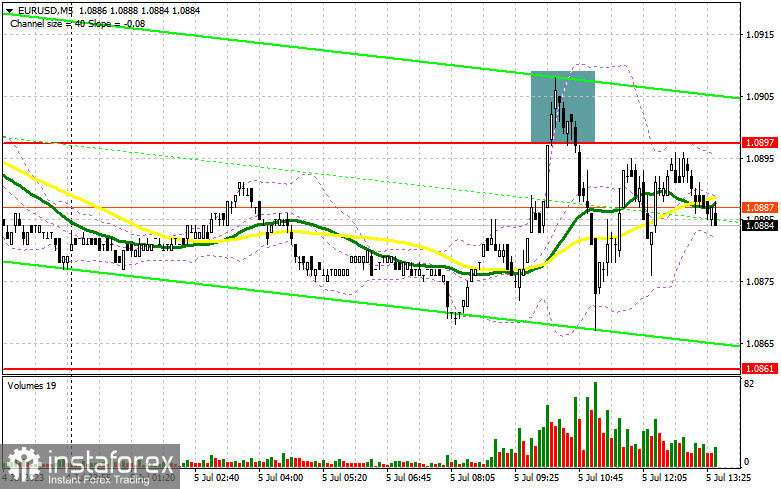
In my morning forecast, I focused on the level of 1.0897 and recommended making decisions about entering the market from it. Let's look at the 5-minute chart and understand what happened there. The increase and the formation of a false breakout at this level after weak statistics on the PMI indices of the eurozone countries provided a sell signal for the euro, which resulted in a fall of the pair by more than 30 points. However, it was not possible to break out of the sideways channel. The technical picture for the second half of the day was partially revised.

To open long positions for EUR/USD:
Weak PMI indices for the eurozone countries in the services sector hint that the economy is seriously skidding. After the summer period, a slowdown in activity in two directions may significantly affect the region's economic growth pace. Given that the ECB intends to continue raising rates, inflicting serious damage on lending, the onset of a recession is just a matter of time. Against this background, problems are increasing for the euro, which still cannot break the 1.1000 mark and is unlikely to do so soon.
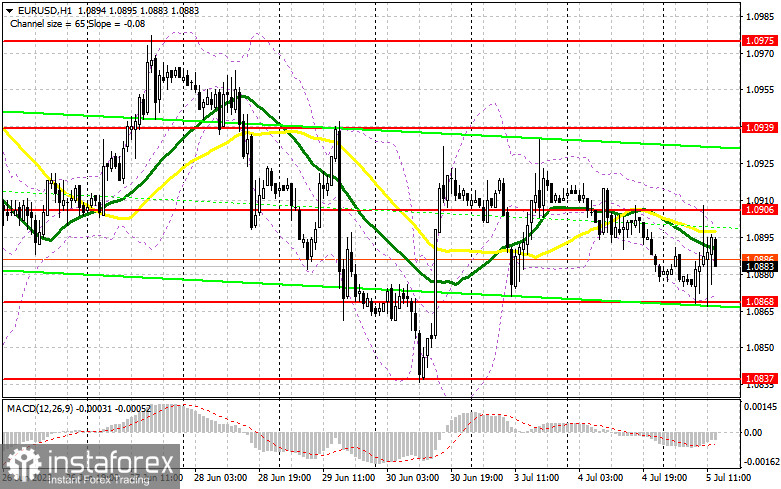
In the second half of the day, we expect statistics on changes in the volume of production orders and the publication of the FOMC meeting minutes. It's unlikely that we'll find something in the minutes that we don't know, so it will all end with just a small surge in volatility. The performance of FOMC member John Williams will be of secondary importance. I prefer to act on a decrease in the pair around the new support 1.0868, formed due to the first half of the day. The formation of a false breakout there will give a buy signal, allowing a return to quite a large resistance of 1.0906. A breakout and top-down test of this range will strengthen demand for the euro, giving it a chance to break out to 1.0939, but this is unlikely. The furthest target remains the 1.0975 area, where I will fix the profit.
In case of a decrease in EUR/USD and the absence of buyers at 1.0868, which may happen against a decrease in risk appetite before the FOMC minutes, bears may continue to act more actively with the expectation of forming a downward correction. Therefore, only the formation of a false breakout around the next support of 1.0838 will give a buy signal for the euro. I will open long positions immediately on the rebound from a minimum of 1.0807 with the aim of an ascending correction of 30-35 points within the day.
To open short positions for EUR/USD:
Sellers actively defend the resistance of 1.0906 and intend to continue doing so. Trading below this level will affect buyers' sentiments before the FOMC minutes, so one can expect a further decrease in EUR/USD. In case of an increase, only another unsuccessful consolidation at 1.0906, similar to what I analyzed above, will give a sell signal, capable of pushing EUR/USD to 1.0868. A consolidation below this range and a reverse bottom-up test is a direct way to 1.0838. The farthest target will be the minimum of 1.0807, where I will fix the profit.

In case of an upward movement of EUR/USD during the US session and the absence of bears at 1.0906, the situation will return to the control of buyers, and the pair will escape from the sideways channel. In such a case, I'll postpone short positions until the next resistance at 1.0939. There you can also sell, but only after unsuccessful consolidation. I will open short positions immediately on a rebound from the maximum of 1.0975 with the target of a downward correction of 30-35 points.
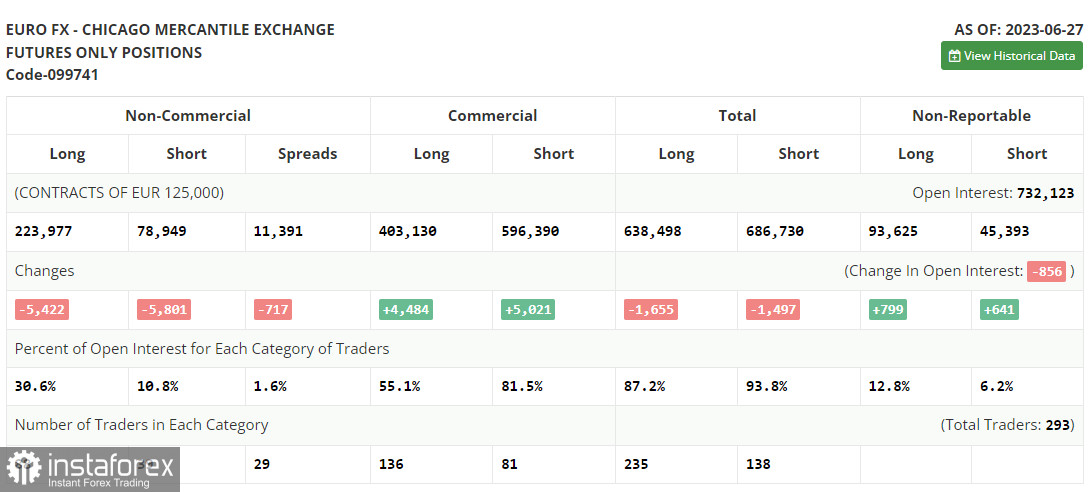
In the COT report (Commitment of Traders) as of June 27, a reduction of long and short positions was observed, which left the balance of power in the market almost unchanged. Data on US GDP released last week once again confirmed the resilience of the American economy even in the face of high-interest rates, which allows the Federal Reserve to continue actively fighting high inflation, gradually coming to normal. In the near future, the minutes of the FRS meeting will be released, and we will also learn about the state of the US labor market, which may strengthen the position of the US dollar against the euro. The optimal medium-term strategy in the current conditions remains to buy on declines. The COT report states that long non-commercial positions decreased by 5,422 to 223,977, while short non-commercial positions fell by 5,801 to 78,949. As a result of the week, the total non-commercial net position grew slightly and amounted to 145,028 against 144,025. The weekly closing price rose and was 11006 against 1.0968.

Indicator signals:
Moving averages
Trading is conducted in 30- and 50-day moving averages, indicating a market equilibrium.
Note. The author considers the period and prices of moving averages on the hourly chart H1. They differ from the general definition of classic daily moving averages on the daily chart D1.
Bollinger Bands
In case of growth, the upper boundary of the indicator will act as resistance around 1.0900.
Indicator descriptions:
• Moving average (smooths out volatility and noise by defining the current trend). Period - 50. It is marked in yellow on the chart;
• Moving average (smooths out volatility and noise by defining the current trend). Period - 30. It is marked in green on the chart;
• MACD Indicator (Moving Average Convergence/Divergence - convergence/divergence of moving averages) Fast EMA - period 12. Slow EMA - period 26. SMA - period 9;
• Bollinger Bands. Period - 20;
• Non-commercial traders - speculators, such as individual traders, hedge funds, and large institutions that use the futures market for speculative purposes and meet certain requirements;
• Long non-commercial positions represent the total long open position of non-commercial traders;
• Short non-commercial positions represent the total short open position of non-commercial traders;
• The total non-commercial net position is the difference between non-commercial traders' short and long positions.


