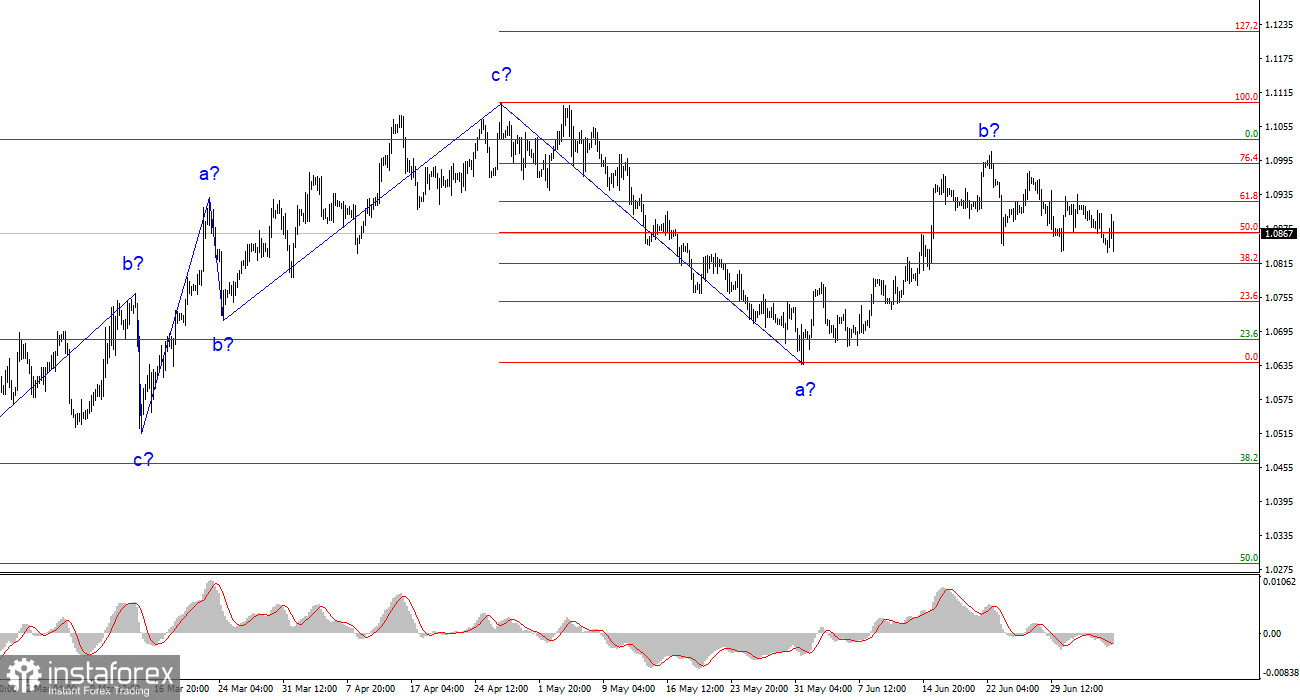
The wave pattern of the 4-hour chart for the EUR/USD pair is slightly unconventional but still quite discernible. The upward section of the trend, starting from March 15, could adopt a more intricate form, yet at present, I predict the emergence of a downward trend section, likely to be a three-wave formation. I have frequently stated that I expect the pair around the 5th figure, where the formation of the ascending three-wave started. I uphold this prediction. As indicated by the subsequent retreat of quotes from the reached peaks, the presumed wave b might have concluded its formation last week.
Nonetheless, considering recent events and, notably, the movements of the GBP/USD pair, I devised an alternate wave pattern that suggests the entire trend section from March 15 to April 26 represents a single wave a. If this is accurate, the next wave is b, and we are currently observing the formation of an upward wave c. If so, the wave patterns for the pound and euro pairs align, and everything falls into place. If this hypothesis is correct, from its current position, the euro will likely resume its rise to the 11th figure and beyond.
The market, having awaited significant reports, has now sprung into action.
Once again, on Thursday, the EUR/USD rate remained the same for the fourth consecutive day. This statement is accurate when writing each article. The European currency has depreciated by roughly 50 basis points this week, equating to a 10-point daily loss. As one can see, I'm pretty close off the mark when I affirm daily that the rate has stayed the same. The day commenced poorly for the US dollar, with a sharp drop in demand and a 45-point increase in the pair's rate. However, several crucial reports were released in the United States during the latter half of the day, each of which I'll scrutinize. For now, I wish to draw attention to the ISM business activity index in the service sector.
The ISM index holds greater significance than the S&P, reflecting business activity. Hence, when we know that the market anticipates an upward movement in the indicator to 50-51 points, and the increase is 53.9, this is a compelling reason to invest in the US dollar. Unfortunately, business activity indices are falling in many countries of the world due to the aggressive monetary policy of central banks (of course, where it is aggressive). The manufacturing sector has long been under the 50-mark, while the service sector has remained above it and has yet to drop below. Jumping ahead slightly, I will mention that the other American reports were not as optimistic, so I attribute the dollar's rise solely to the ISM index.
General Conclusions
Based on the conducted analysis, a downward trend segment continues. The pair has quite a large room for decrease. I still believe that targets in the range of 1.0500-1.0600 are quite realistic, and I advise selling the pair according to the MACD "down" signals with these targets. The presumed wave b appears to be complete. In the alternative marking, the ascending wave will be more extended and complex; this scenario will become the main one in the event of a successful attempt to break through the current peak of wave b.
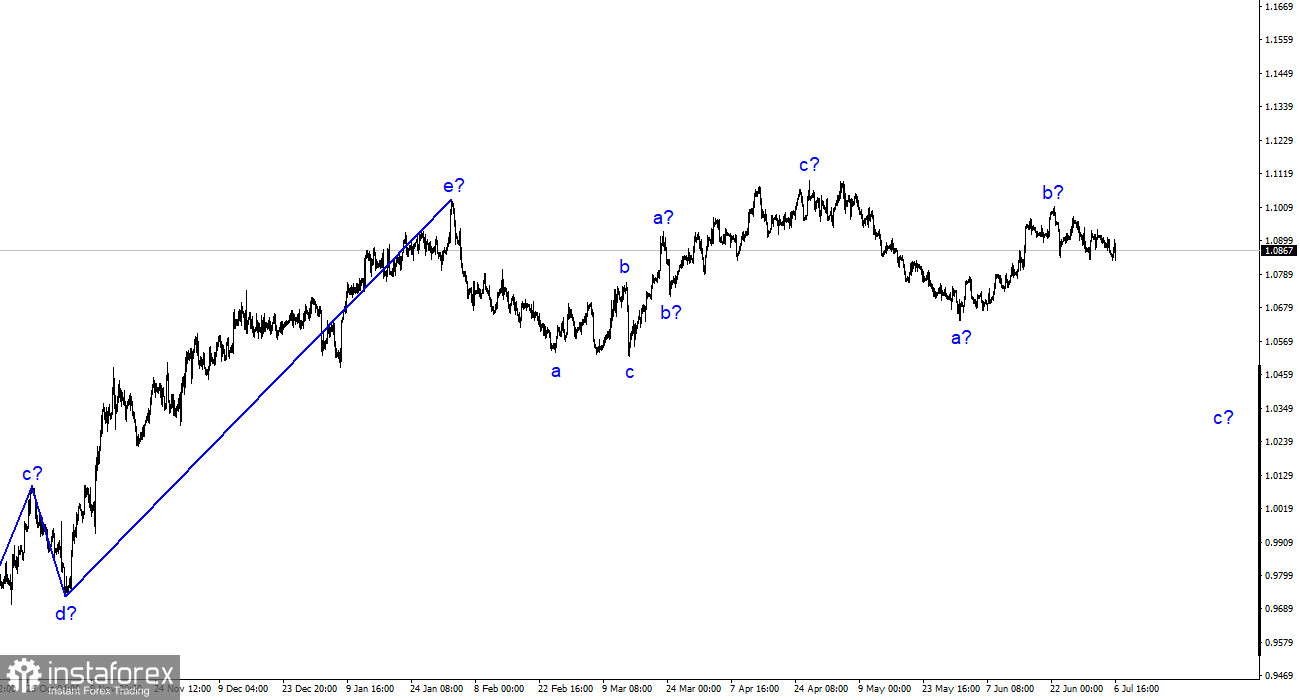
On a larger wave scale, the wave marking of the upward trend segment has taken an extended form, but it is probably completed. We have seen five waves up, forming an a-b-c-d-e structure. Then the pair built two three-wave patterns: down and up. It is probably in the process of constructing another downward three-wave structure.


