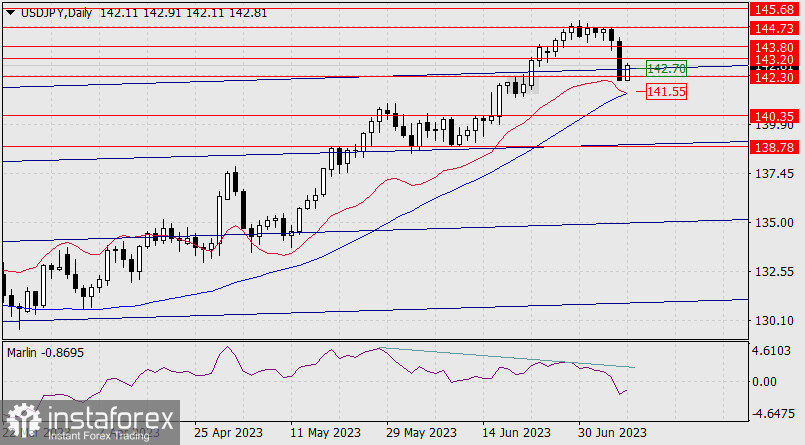
The long-awaited divergence on the daily chart of the USD/JPY pair has been formed. The pair fell by 257 pips on Thursday and Friday. It broke through the support level of 142.70 and 142.30. This morning, the pair returned above 142.30. It may try to rise above 142.70. This scenario looks likely given a decrease in Japan's surplus, which amounted to 1.70 trillion yen in May versus 1.90 trillion in April.

Pivot levels are rather strong. To break through 143.80, the price has been consolidating for 6 days in a narrow range. Now, it is unable to grow due to strong resistance levels of 142.70 and 143.20. The support level is located at 141.55. So, the pair could enter a new wide range of 141.55-143.20.

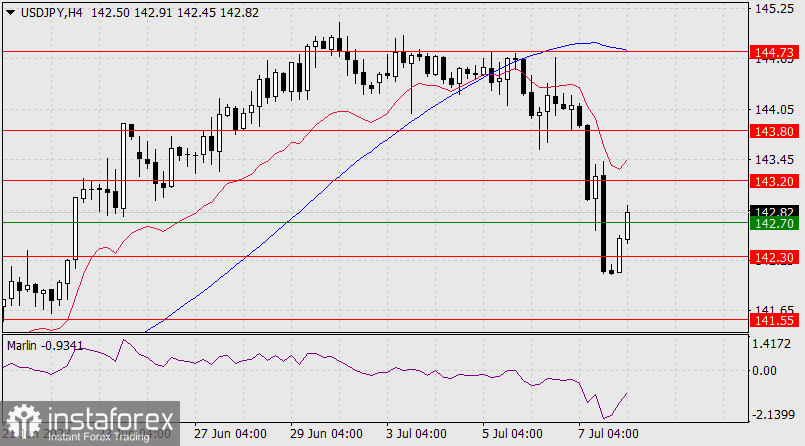
On the 4H chart, the price declined below the indicator lines. There may be an upward movement to these lines. The price may also slide into the sideways channel. If so, it will be easier for the pair to reach these levels. The Marlin oscillator went up sharply when approaching the oversold zone. The short-term outlook remains foggy. Traders need to wait for new signals.


