


Analyzing Monday's trades:
GBP/USD on 30M chart
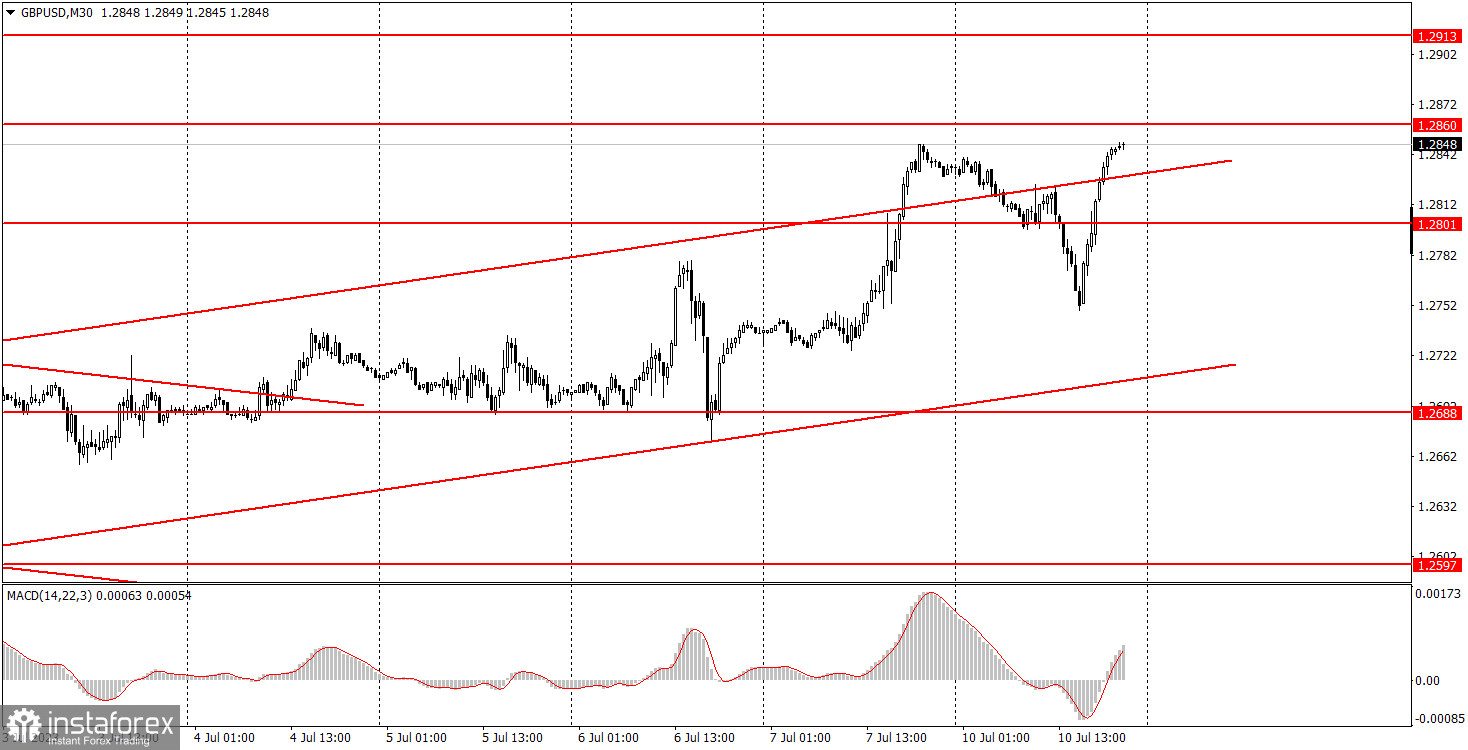
The GBP/USD pair managed to both rise and fall on Monday. The pound sterling corrected against Friday's decline, but in the second half of the day, it traded higher again, which corresponds to the current trend. There were no important economic reports in the UK or in the US. Three representatives of the FOMC spoke in the US, and Bank of England Governor Andrew Bailey is usually speaking in the UK around this time.
For obvious reasons, Bailey's speech could not have any influence on the pair's movements during the day. And the FOMC members' speeches took place in the evening, so they also could not have provoked either the morning fall or the afternoon rise. However, volatility was over 100 points, which is quite a lot for a Monday. The uptrend persists, and we have to point out that the growth is groundless, but there's nothing we can do if the market wishes to buy the pair, regardless of the fundamental background.
GBP/USD on 5M chart
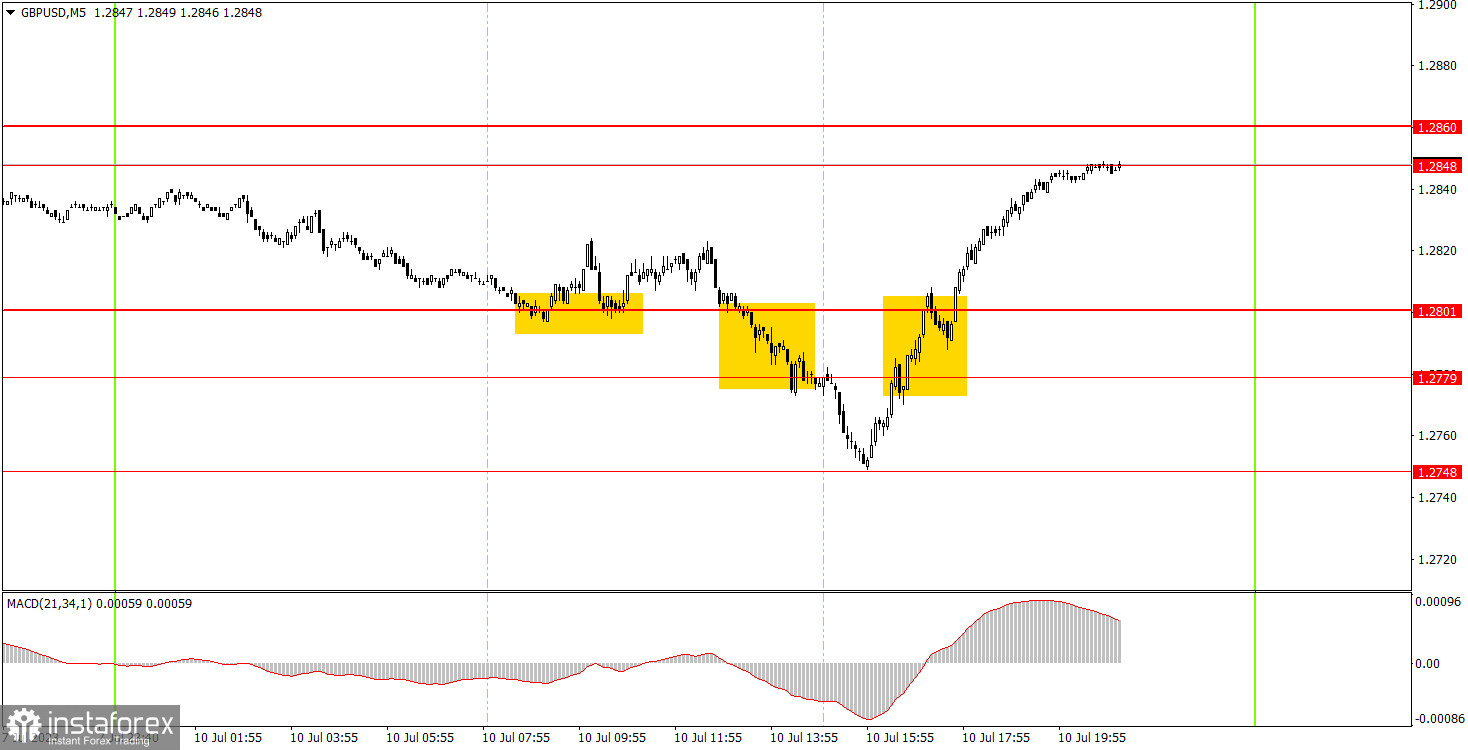
Several entry points materialized on the 5M chart. First, the pair bounced twice from the level of 1.2801 (buy signals duplicated each other), but it only rose by 13 pips. It was impractical to work out these signals, as there was a high probability of a flat on Monday, and the Stop Loss on the deal should have been set below the level of 1.2779. When a sell signal was formed in the form of overcoming the area of 1.2779-1.2801, it was already clear that there would be no flat, so the deal could be worked out, but it did not bring profit, it closed at a break-even stop loss. The next buy signal could have been executed, and it would have brought a profit of 30 pips. In general, the pair changed its direction of movement several times on Monday, which is always bad for intraday trading.
Trading tips on Tuesday:
As seen on the 30M chart, the GBP/USD pair continues to form a new uptrend. The pound can still rise even on those days when there is no fundamental background. Therefore, purely technically, GBP may extend its upward movement, but fundamental factors are still very doubtful. The key levels on the 5M chart are 1.2538, 1.2597-1.2605, 1.2653, 1.2688, 1.2748, 1.2779-1.2801, 1.2848-1.2860, 1.2913, 1.2981-1.2993. When the price moves 20 pips in the right direction after opening a trade, a stop loss can be set at breakeven. On Tuesday, the UK will release reports on jobless claims, unemployment, and wages. In the US, Federal Reserve official James Bullard will speak.
Basic trading rules:
1) The strength of the signal depends on the time period during which the signal was formed (a rebound or a break). The shorter this period, the stronger the signal.
2) If two or more trades were opened at some level following false signals, i.e. those signals that did not lead the price to Take Profit level or the nearest target levels, then any consequent signals near this level should be ignored.
3) During the flat trend, any currency pair may form a lot of false signals or do not produce any signals at all. In any case, the flat trend is not the best condition for trading.
4) Trades are opened in the time period between the beginning of the European session and until the middle of the American one when all deals should be closed manually.
5) We can pay attention to the MACD signals in the 30M time frame only if there is good volatility and a definite trend confirmed by a trend line or a trend channel.
6) If two key levels are too close to each other (about 5-15 pips), then this is a support or resistance area.
How to read charts:
Support and Resistance price levels can serve as targets when buying or selling. You can place Take Profit levels near them.
Red lines are channels or trend lines that display the current trend and show which direction is better to trade.
MACD indicator (14,22,3) is a histogram and a signal line showing when it is better to enter the market when they cross. This indicator is better to be used in combination with trend channels or trend lines.
Important speeches and reports that are always reflected in the economic calendars can greatly influence the movement of a currency pair. Therefore, during such events, it is recommended to trade as carefully as possible or exit the market in order to avoid a sharp price reversal against the previous movement.
Beginners should remember that every trade cannot be profitable. The development of a reliable strategy and money management are the key to success in trading over a long period of time.


