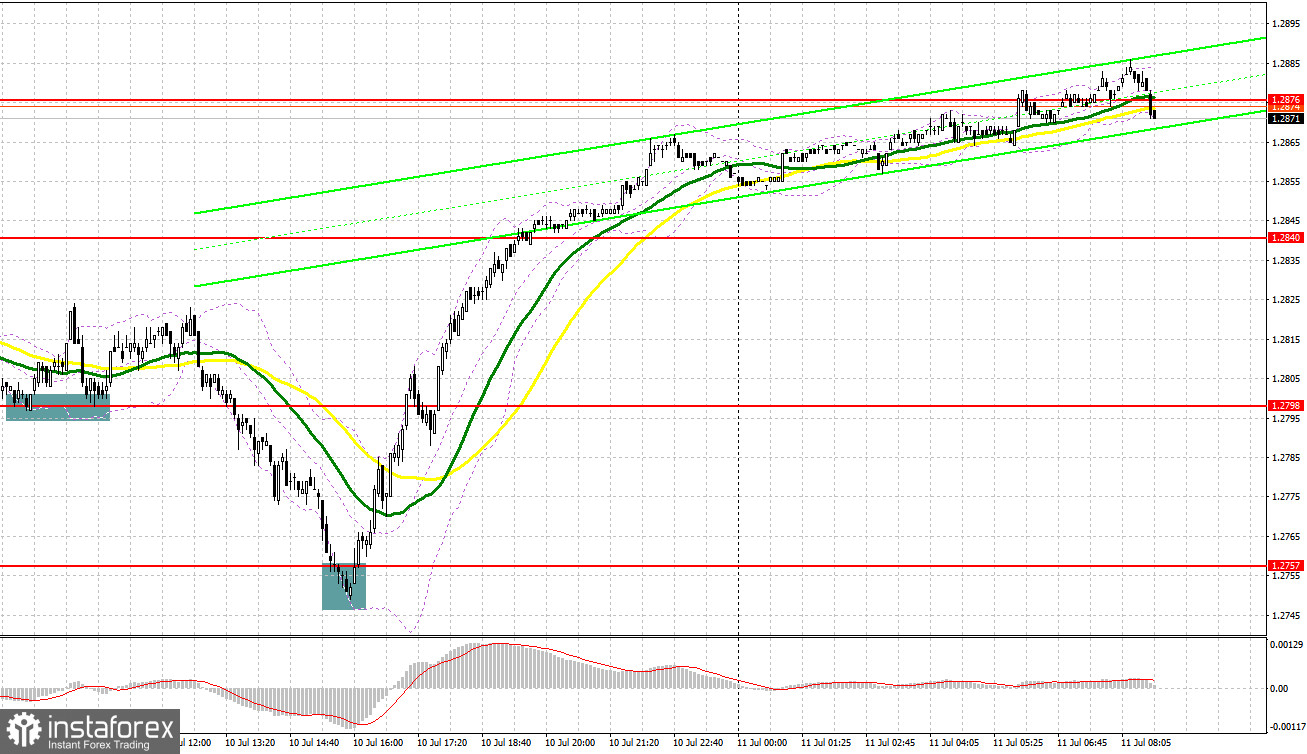
Yesterday, a few entry signals were generated. Let's look at the 5-minute chart to get a picture of what happened. Previously, I considered entering the market from the level of 1.2798. After a fall and a false breakout there, a buy signal came, but pressure on the pair increased after a rise in value by some 20 pips. After a sell-off and a false breakout at 1.2757, another entry point was created, and quotes surged by over 100 pips.

When to open long positions on GBP/USD:
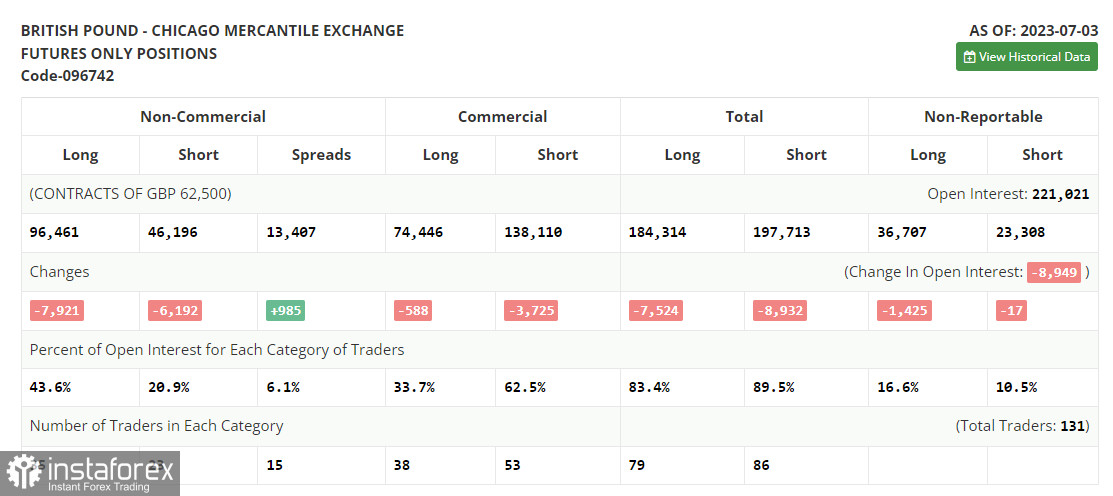
Before analyzing the situation from the technical point of view, let's look at developments in the futures market. The COT report from July 3 logged a decrease in both long and short positions. Buyers will likely be aggressive due to the hawkish Bank of England. The regulator prefers to keep interest rates high despite all the pressure and economic issues because inflation remains persistent, affecting the welfare of households. No matter what the Fed's policymakers say, traders are now betting on a weaker US dollar in the medium term. This is due to the nearly-peaking interest rates in the US. Therefore, buying the pound during falls remains an optimal trading strategy. According to the latest COT report, short non-commercial positions dropped by 6.192 to 46,196, while long non-commercial positions fell by 7,921 to 96,461. The total non-commercial net position edged down to 50,265 versus 51,994 a week earlier. The weekly closing price declined to 1.2698 from 1.2735.

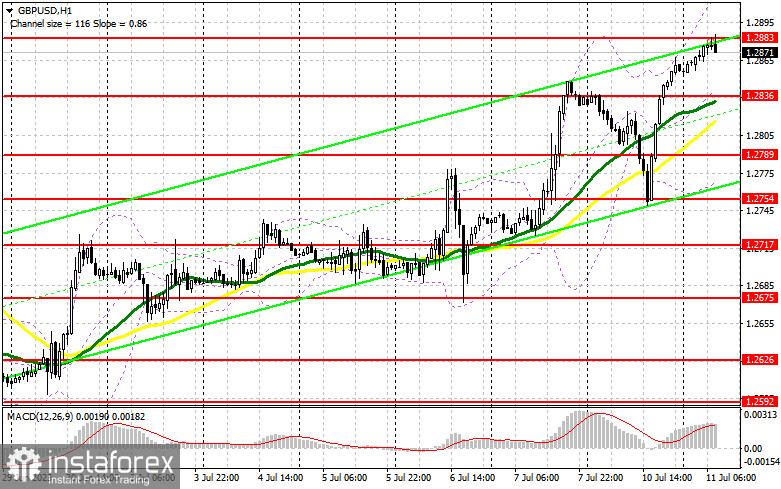
Today, the UK will see the release of another report on its labor market. If the situation does not get worse, the pound will likely continue its bullish trend that lasts since the beginning of this month. Of course, it is wiser to trade on a decline at the nearest support level of 1.2836, formed yesterday. This is where the bullish moving averages are also located. This will create an excellent entry point with an upward target at 1.2883 resistance, which is temporarily limiting the upside potential of the pair. A breakout and downside test of this range will make an additional buying signal, boosting the pound and leading to a retest of 1.2911. Without this level, GBP/USD buyers will hardly be able to continue the uptrend. In case of a breakout above this range, we can expect a surge towards 1.2943, where I will take profit. If GBP/USD declines and there are no buyers at 1.2836, where the moving averages are also located, pressure on the pound will increase. If that happens, I will open long positions at 1.2789 on a false breakout only as well as immediately on a rebound from 1.2754, allowing a 30-35 pips correction intraday.
When to open short positions on GBP/USD:
The bears did everything they could yesterday, but they failed to maintain control over the market. It is crucial now to prevent the pair from breaking beyond the nearest resistance at 1.2883, which will be difficult to do if labor market data comes upbeat. Only a false breakout there will signal to sell, targeting 1.2836 support, where I anticipate an increase in buying activity. A breakout and a retest to the upside of this range will produce a sell entry point with the target at 1.2789. The most distant target is seen at a low of 1.2754, where I will take profit. If GBP/USD rises and there are no bears at 1.2883, the situation will remain under the control of buyers. In such a case, only a false breakout around the next resistance at 1.2911 will serve as a sell entry point and the pair show a downward movement. If there is no activity there, I will sell GBP/USD from 1.2943, allowing a bearish correction of 30-35 pips intraday.

Indicator signals:
Moving averages:
Trading is carried out above the 30-day and 50-day moving averages, which indicates a bullish continuation in the market.
Note: The author considers the period and prices of moving averages on the H1 (1-hour) chart that differ from the general definition of the classic daily moving averages on the daily D1 chart.
Bollinger Bands
Support stands at 1.2790, in line with the lower band. Resistance is seen at 1.2920, in line with the lower band.
Indicator description:
- Moving average (MA) determines the current trend by smoothing volatility and noise. Period 50. Colored yellow on the chart.
- Moving average (MA) determines the current trend by smoothing volatility and noise. Period 30. Colored green on the chart.
- Moving Average Convergence/Divergence (MACD). Fast EMA 12. Slow EMA 26. SMA 9.
- Bollinger Bands. Period 20
- Non-commercial traders are speculators such as individual traders, hedge funds, and large institutions who use the futures market for speculative purposes and meet certain requirements.
- Long non-commercial positions are the total long position of non-commercial traders.
- Non-commercial short positions are the total short position of non-commercial traders.
- Total non-commercial net position is the difference between the short and long positions of non-commercial traders.


