


Analysis of trades on Tuesday:
EUR/USD 30M Chart
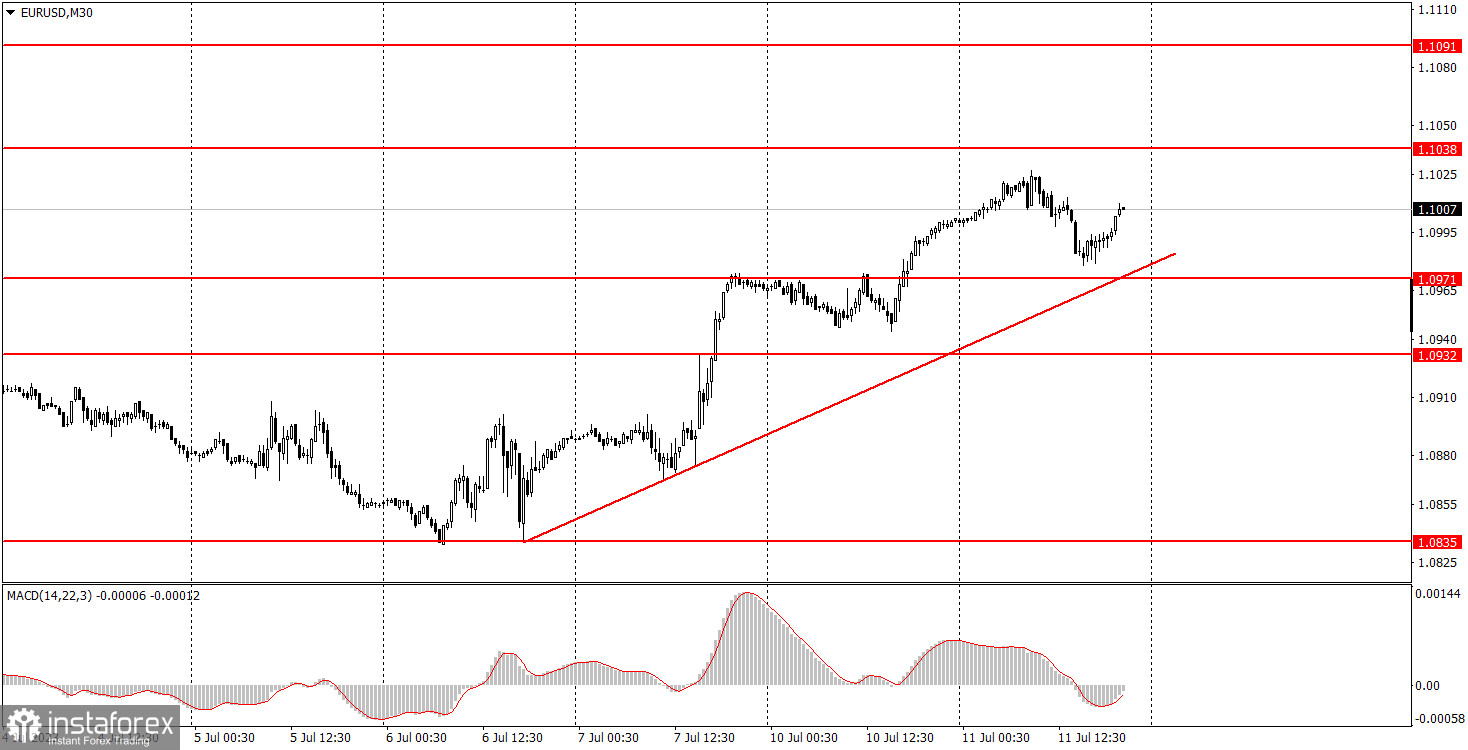
The EUR/USD pair continued its overall upward movement during the second trading day of the week, although a downward correction also occurred. The volatility today was 50 pips, which is considered low. Only two relatively insignificant reports were published during the day in the European Union: the economic expectations index in Germany and the EU. Both reports turned out to be weaker than forecasted, so a slight decline in the euro currency in the middle of the day would have been logical. But this logic was not realized. Even today, when there were no reasons for the dollar to decline, it still fell.
The upward trend line remains relevant, indicating that the pair may continue its upward movement. Although the euro behaves more logically than the pound, questions arise once again as to what fuels the ongoing upward movement, considering that macroeconomic statistics regularly disappoint markets both in the US and the European Union.
EUR/USD 5M Chart
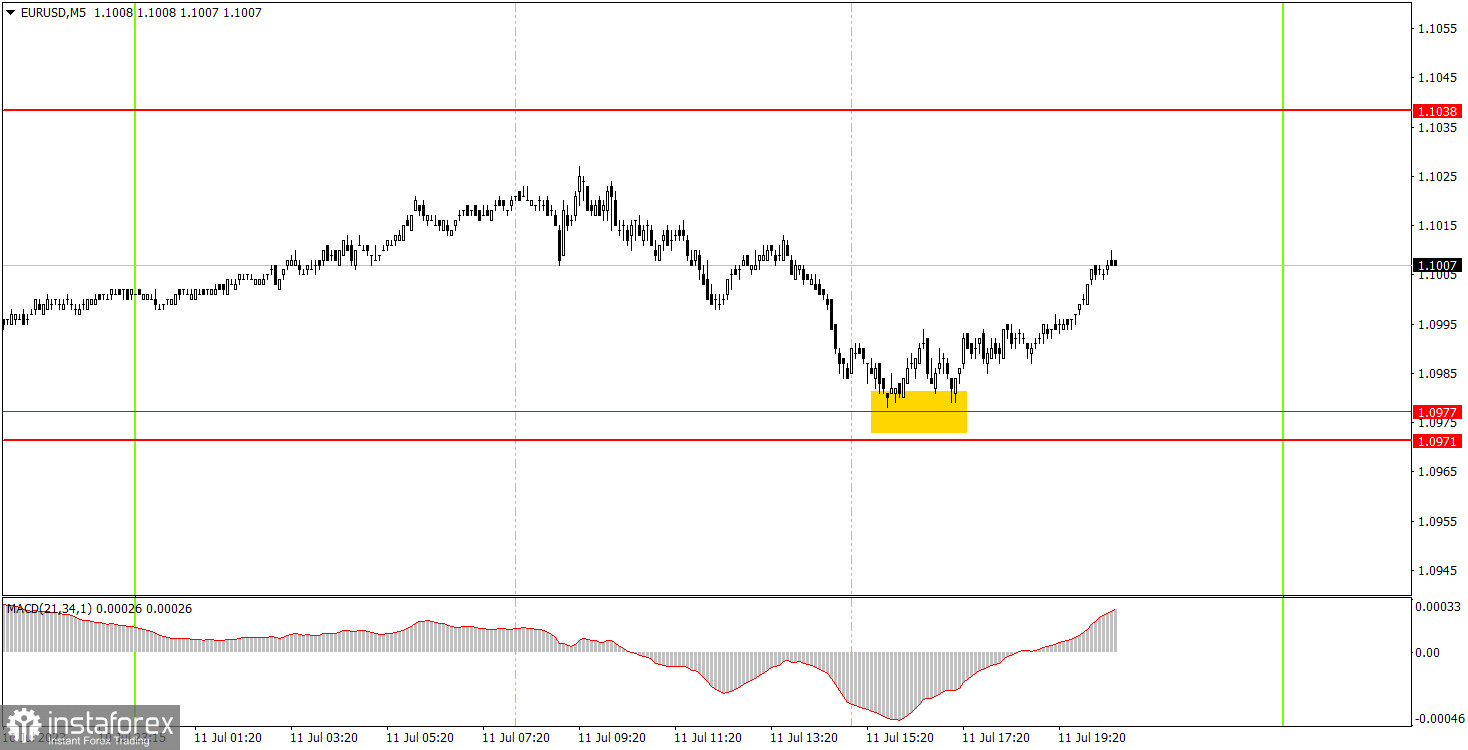
On the 5-minute timeframe on Tuesday, only one trading signal was formed. The pair rebounded from the area of 1.0971-1.0977 at the beginning of the American trading session. Fortunately, there was only one trading signal while the intraday movements were trending. Otherwise, there could have been many false signals, which would have resulted in losses for novice traders. The single buy signal brought about 20 pips of profit, and the trade should have been manually closed by the evening. It's not much, but we could not expect anything more when the overall volatility of the day was just 50 pips.
Trading plan for Wednesday:
On the 30-minute timeframe, the pair continues to form a new upward trend. A short-term upward trend line has formed, but it cannot yet be considered strong. The euro currency has been rising in recent days, even when there are no apparent reasons for it. It seems to have followed the suit of the British currency that continues rising with no solid reason. On the 5-minute timeframe, the levels to consider tomorrow are 1.0733, 1.0761, 1.0835, 1.0871, 1.0901, 1.0932, 1.0971-1.0977, 1.1038, 1.1091, and 1.1132. When a profit of 15 pips in the right direction is achieved, a stop loss can be set at breakeven. On Wednesday, the chief economist of the ECB, Philip Lane, will speak in the European Union, while in the United States, there will be a highly important inflation report, which traders could have been anticipating since the beginning of the week. It could explain the decline in the dollar, as forecasts suggest a significant slowdown in inflation for June.
The basic rules of the trading system:
1) The strength of the signal depends on the time period during which the signal was formed (a rebound or a break). The shorter this period, the stronger the signal.
2) If two or more trades were opened at some level following false signals, i.e. those signals that did not lead the price to Take Profit level or the nearest target levels, then any consequent signals near this level should be ignored.
3) During the flat trend, any currency pair may form a lot of false signals or do not produce any signals at all. In any case, the flat trend is not the best condition for trading.
4) Trades are opened in the time period between the beginning of the European session and until the middle of the American one when all deals should be closed manually.
5) We can pay attention to the MACD signals in the 30M time frame only if there is good volatility and a definite trend confirmed by a trend line or a trend channel.
6) If two key levels are too close to each other (about 5-15 pips), then this is a support or resistance area.
How to read charts:
Support and Resistance price levels can serve as targets when buying or selling. You can place Take Profit levels near them.
Red lines are channels or trend lines that display the current trend and show which direction is better to trade.
MACD indicator (14,22,3) is a histogram and a signal line showing when it is better to enter the market when they cross. This indicator is better to be used in combination with trend channels or trend lines.
Important speeches and reports that are always reflected in the economic calendars can greatly influence the movement of a currency pair. Therefore, during such events, it is recommended to trade as carefully as possible or exit the market in order to avoid a sharp price reversal against the previous movement.
Beginning traders should remember that every trade cannot be profitable. The development of a reliable strategy and money management are the key to success in trading over a long period of time.


