


EUR/USD has once again shown moderate volatility, but what difference does it make when the pair is moving in only one direction? Yes, this growth is not strong, but the pair adds 30-40 pips every day, which is a significant increase despite low volatility. It is even more difficult to realize why the euro is rising again while the dollar is falling. In reality, almost any market movement can be easily explained. It is done by only considering the factors that confirm the current movement.
At the beginning of this week, several disappointing reports came in the eurozone. Some ECB officials continue to hint that the tightening cycle is nearing. It seems to be a great factor for the pair to fall. Nevertheless, the market is still bullish, and experts keep searching for reasons why the euro is rising. Sometimes their explanations seem simply absurd, but there are no others! For example, one can now say that the market is anticipating the US inflation report, which is due today. The consumer price index in the US may slow down to 3.1%, which will raise questions about two more rate hikes by the Fed.
However, at the same time, the market pays no attention to core inflation, which remains above 5% and desperately needs two more rate hikes to eventually reach the target level. It turns out that the market is turning a blind eye to core inflation but is eagerly responding to headline inflation, which hasn't even been published yet!
Today, the infamous inflation report in the US, which has already caused a stir in the market, will be released. According to forecasts, inflation may slow down to 3.1% in June from the current 4%. Naturally, this would be a significant decline. That is why the market could have started reacting to it in advance. However, we may also see a figure today that will be significantly different from the forecast.
Scenario 1: The actual inflation value will be lower than 3.1%. In this case, we can expect a further decline in the greenback. The market has presumably already priced in a decrease to 3.1%, but not a bigger one. Therefore, under the current circumstances where traders are eager to sell the dollar, we can anticipate its further fall.
Scenario 2: Inflation will come in at 3.1%. This figure may have already been priced in. However, it is merely a hypothesis as no one knows if the market is currently pricing inflation data in or is simply buying euros and selling dollars. Therefore, a 3.1% value should trigger a decline in the euro against the dollar. Nevertheless, we may well see an uptrend continuation.
Scenario 3: Inflation will be higher than 3.1%. In this case, the dollar should strengthen, but it may be a sluggish movement. The market is again inclined to buy the pair, so we hardly be surprised if the dollar temporarily strengthens and then resumes its decline. Thus, in almost any case, the dollar is not expected to noticeably strengthen today. The inflation report should come out almost shocking to witness a rally in the greenback.
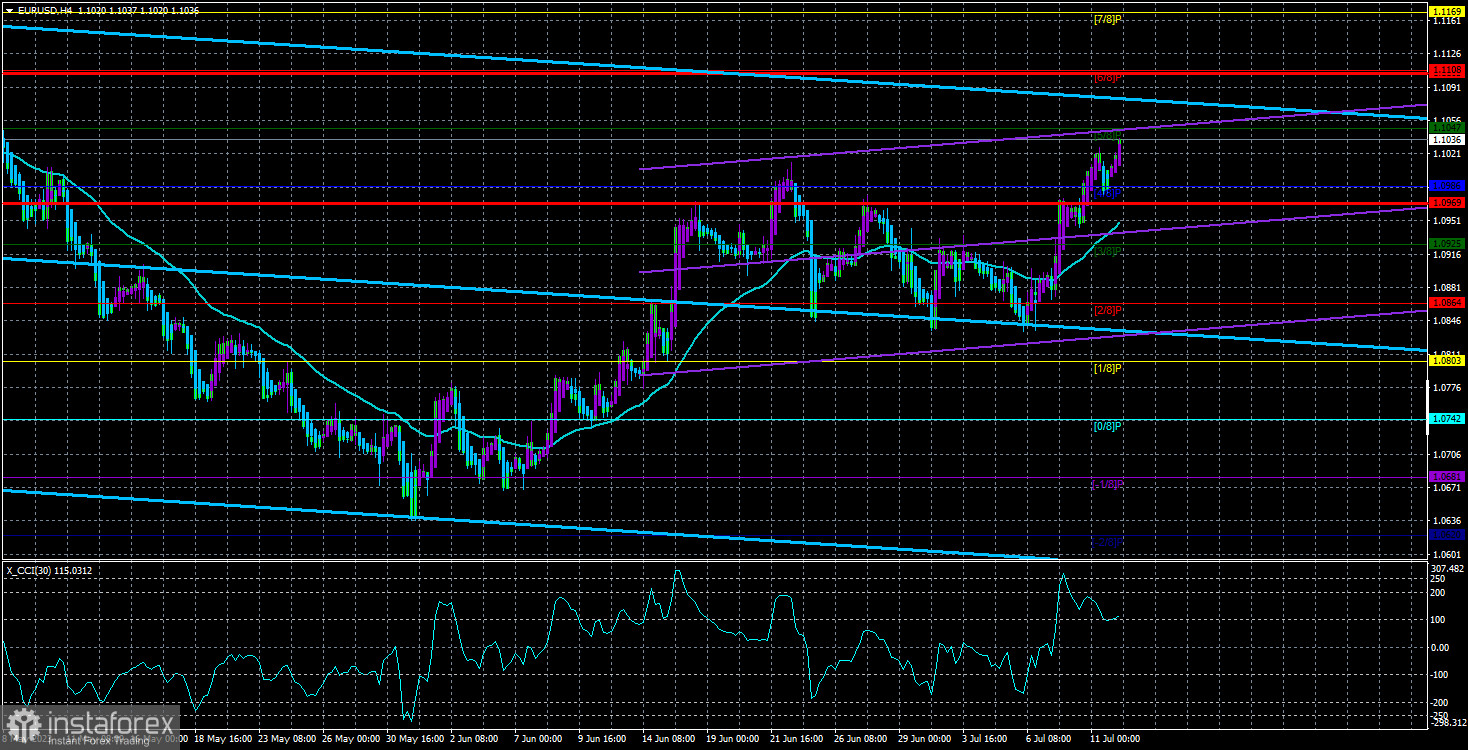
Notably, the CCI indicator has entered the overbought zone. It has frequently visited extreme areas lately. This means that the market is in that state when its movements can hardly be explained. However, this is something we have known for a long time as the euro continues to trade at high levels. At the same time, it keeps consolidating between 1.05 and 1.11 in the long term.
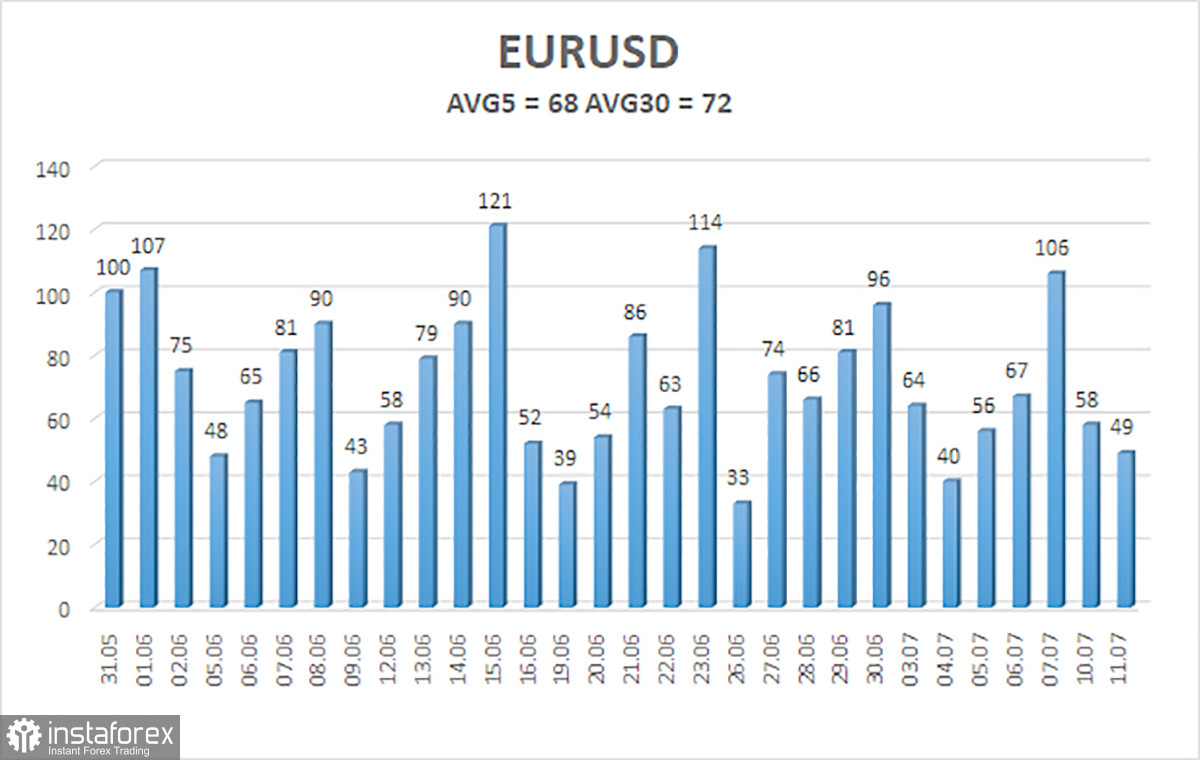
The 5-day average volatility of EUR/USD totals 68 pips on July 12 and is considered moderate. The price will likely be in the range between 1.0969 and 1.1105 on Wednesday. Heikin Ashi's reversal to the downside will indicate a bearish correction.
Support:
S1 – 1,0986
S2 – 1,0925
S3 – 1,0864
Resistance:
R1 – 1.1047
R2 – 1.1108
R3 – 1.1169
Outlook:
EUR/USD has resumed the uptrend. We can hold long positions with targets at 1.1047 and 1.1105 until Heikin-Ashi's reversal to the downside. Once the price consolidates below the Moving Average with targets at 1.0925 and 1.0864, we can consider selling.
Indicators on charts:
Linear Regression Channels help identify the current trend. If both channels move in the same direction, a trend is strong.
Moving Average (20-day, smoothed) defines the short-term and current trends.
Murray levels are target levels for trends and corrections.
Volatility levels (red lines) reflect a possible price channel the pair is likely to trade in within the day based on the current volatility indicators.
CCI indicator. When the indicator is in the oversold zone (below 250) or in the overbought area (above 250), it means that a trend reversal is likely to occur soon.


