


Trend analysis (Fig. 1).
The GBP/USD currency pair may move upward from the level of 1.2928 (closing of yesterday's daily candle) with the target of reaching the upper boundary of the Bollinger Bands indicator at 1.2995 (black dotted line). In the case of testing this level, the price may move downward towards the target of 1.2875, the 5-day EMA (thin red line).
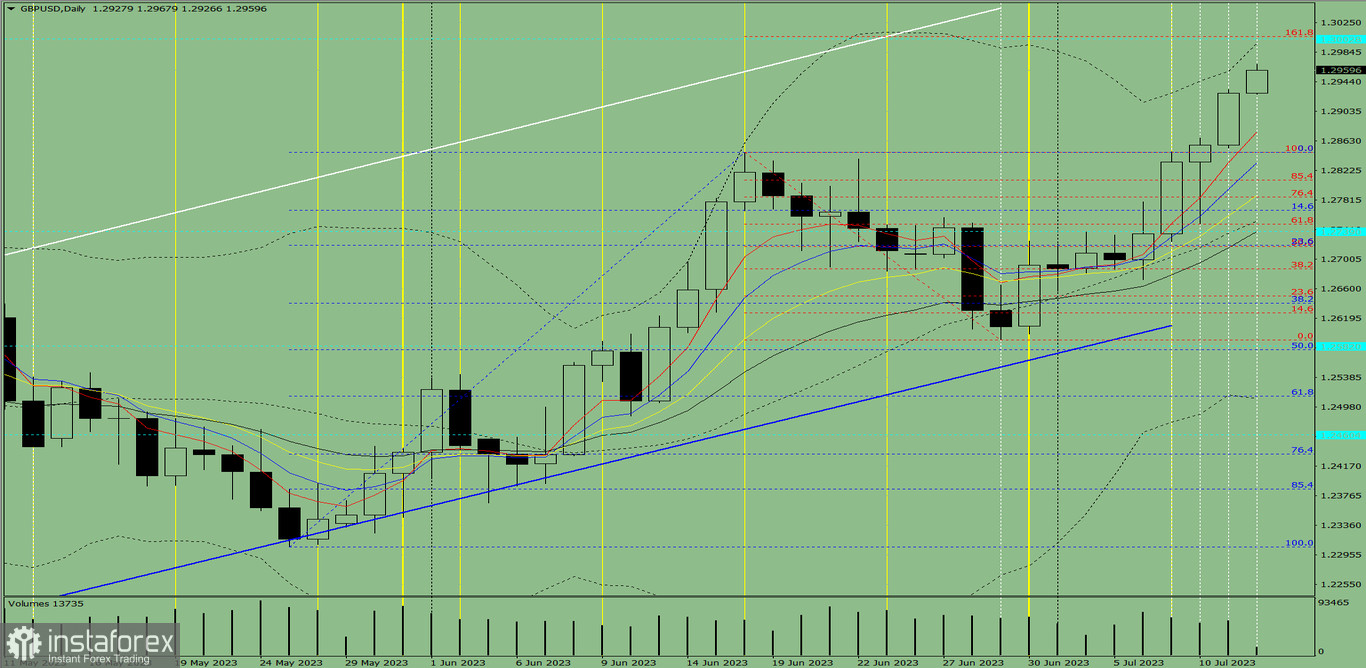
Fig. 1 (daily chart).
Comprehensive analysis:
- Indicator analysis – upward.
- Fibonacci levels – upward.
- Volumes – upward.
- Candlestick analysis – upward.
- Trend analysis – upward.
- Weekly chart – upward.
- Bollinger Bands – upward.
General conclusion:
Today, the price may move upward from the level of 1.2928 (closing of yesterday's daily candle) with the target of reaching the upper boundary of the Bollinger Bands indicator at 1.2995 (black dotted line). In the case of testing this level, the price may move downward towards the target of 1.2875, the 5-day EMA (thin red line).
Alternatively, the price may move upward from the level of 1.2928 (closing of yesterday's daily candle) with the target of reaching the upper boundary of the Bollinger Bands indicator at 1.2995 (black dotted line). In the case of testing this level, the price may continue moving upwards towards the target of 1.3006, the 161.8% pullback level (red dotted line).


