


EUR/USD
Higher timeframes
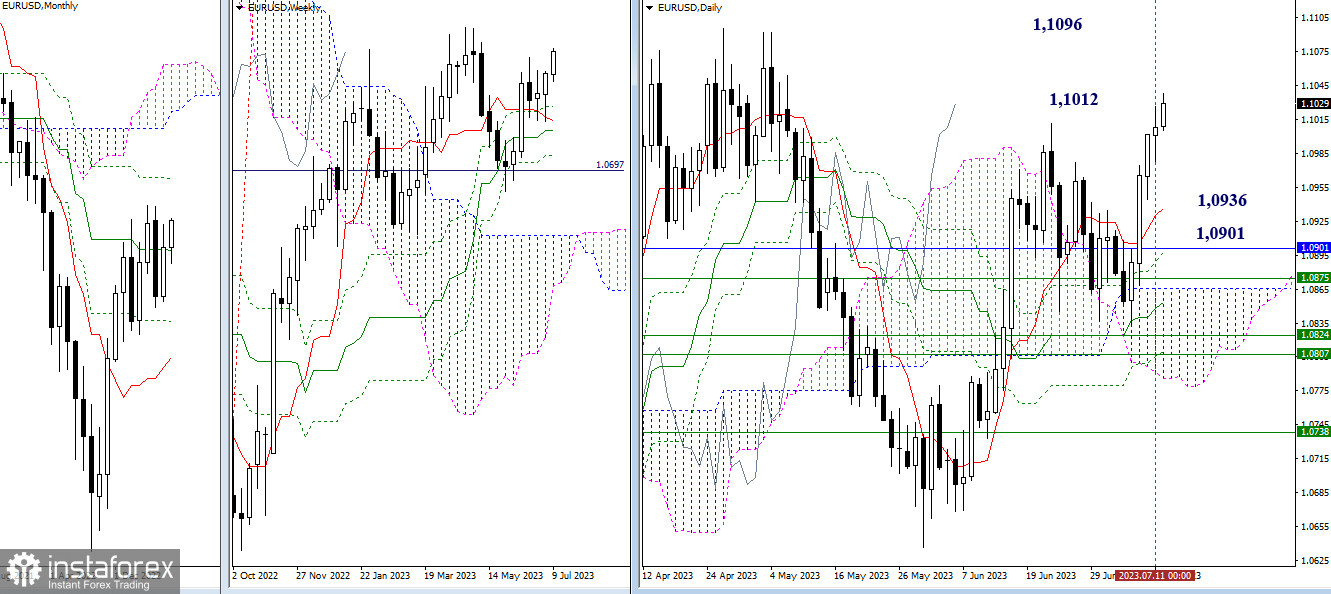
Bulls continue to rise, but failed to close above the high of the daily correction (1.1012) yesterday. This mark and the next high of the weekly correction (1.1096) remain the main targets of the current upward movement. The nearest supports of the higher timeframes today are 1.0936 (daily short-term trend) and 1.0901 (monthly medium-term trend).
H4 - H1
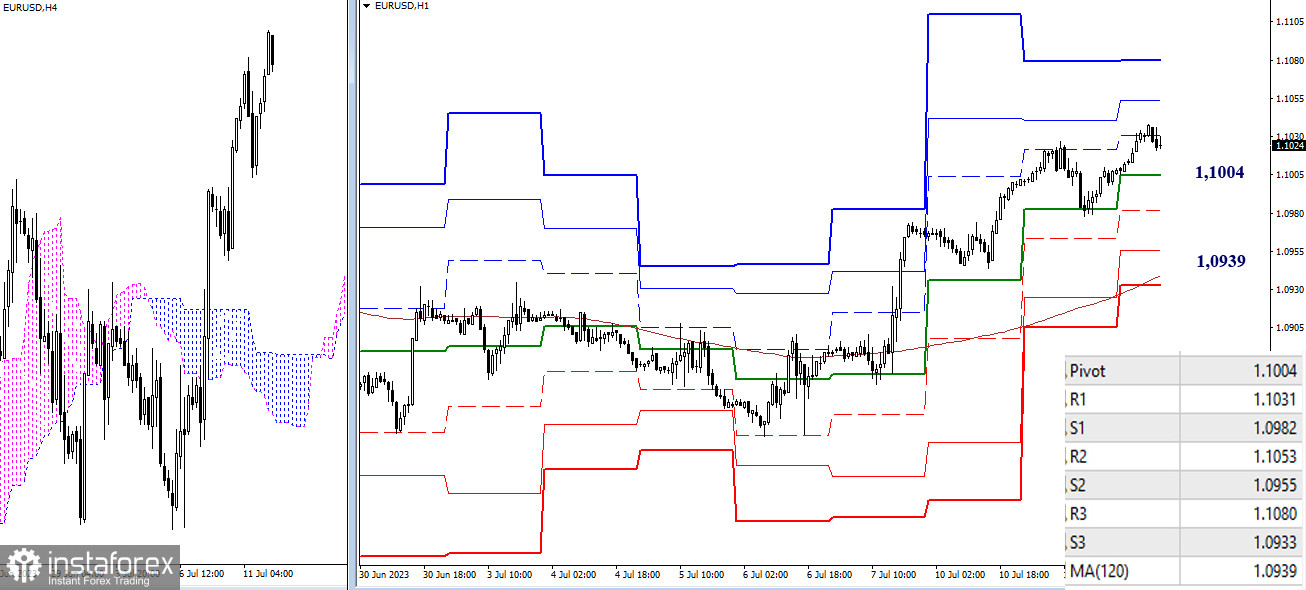
On lower timeframes, the main advantage now belongs to the bulls. As of writing, they are testing the first resistance of the classic pivot points (1.1031), and further targets for an intraday rise are R2 (1.1053) and R3 (1.1080). The key levels today serve as supports and are located at 1.1004 (central pivot point) and 1.0939 (weekly long-term trend); intermediate supports are S1 (1.0982) and S2 (1.0955). The weekly long-term trend (1.0939) is currently reinforced by the daily short-term trend (1.0936), so a consolidation below will help change the current balance of power not only on lower timeframes but also on the daily timeframe.
***
GBP/USD
Higher timeframes
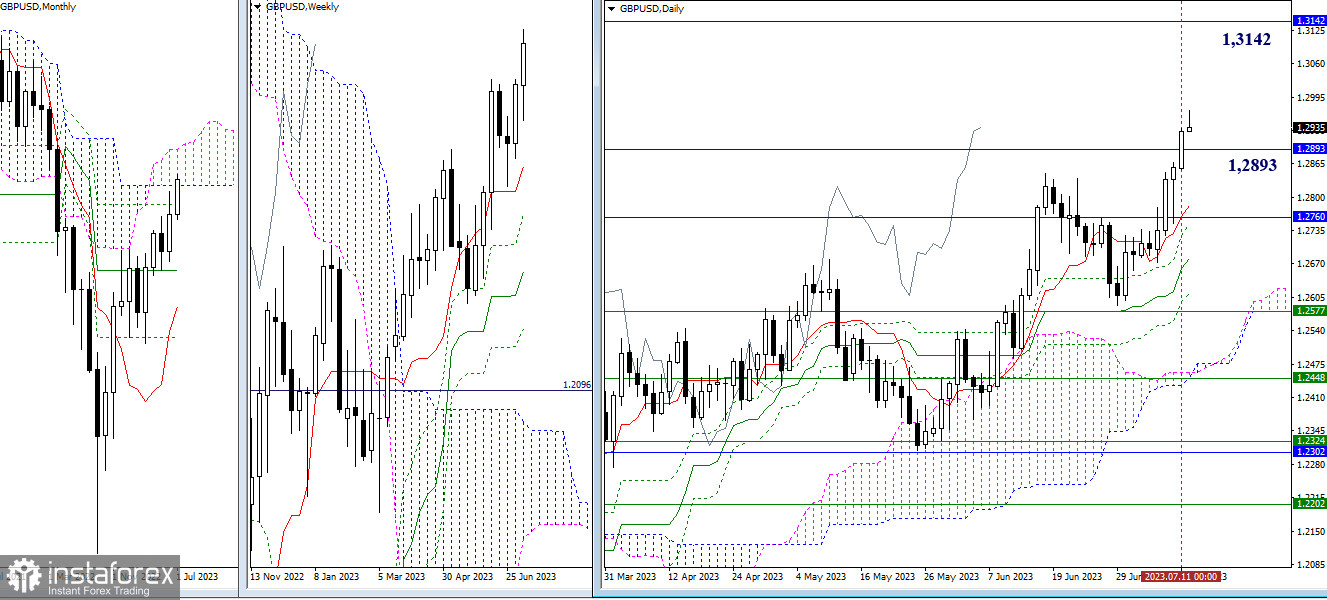
Yesterday, on the daily chart, the pound crossed the lower border of the monthly cloud (1.2893). This is an important monthly level, so it may yet have its influence and, thanks to the force of attraction, delay the continuation of the rise. If the bulls maintain activity, the upper border of the monthly cloud (1.3142) serves as their next target in this area.
H4 - H1
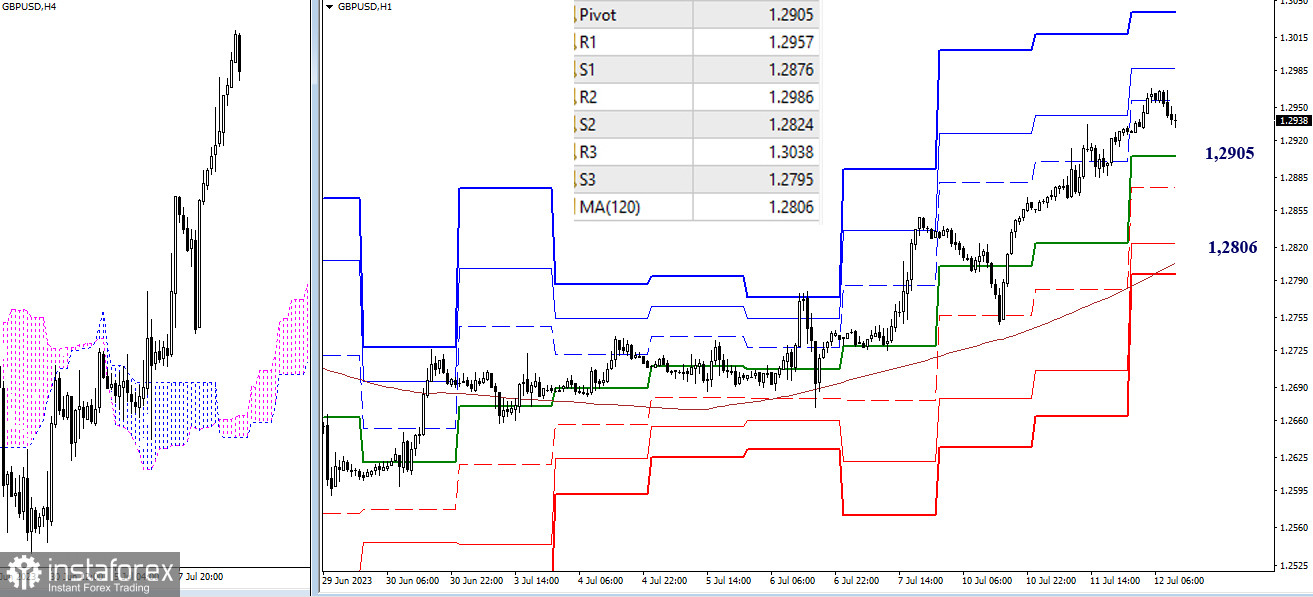
On lower timeframes, the bulls are developing an upward trend movement, having a clear advantage. It should be noted that during trend movement, corrective declines are as natural as rises. At the moment, we observe a corrective slowdown around 1.2957 (first resistance of the classic pivot points). Further upward targets within the day are R2 (1.2986) and R3 (1.3038). In case the current correction deepens, the chart on lower timeframes suggests the following levels as supports today: 1.2905 (central pivot point) - 1.2876 (S1) - 1.2824 (S2) - 1.2806 (weekly long-term trend).
***
The technical analysis of the situation uses:
Higher timeframes - Ichimoku Kinko Hyo (9.26.52) + Fibo Kijun levels
Lower timeframes - H1 - Pivot Points (classic) + Moving Average 120 (weekly long-term trend)


