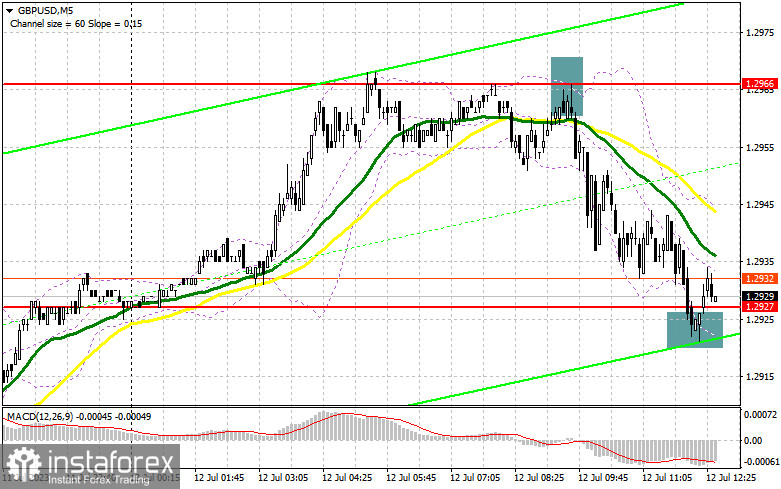
In my morning forecast, I drew attention to the level of 1.2966 and recommended making market entry decisions from it. Let's look at the 5-minute chart and figure out what happened there. The growth and formation of a false breakout at 1.2966 provided an excellent entry point for short positions, which led to the pair's fall by more than 40 points. The technical picture has mostly stayed the same for the second half of the day.

To open long positions on GBP/USD, you need:
Obviously, the Governor of the Bank of England, Andrew Bailey, has not told the market anything new, which has led to a correction of the pound in the first half of the day. During the American session, important US inflation data is being released, which could lead to a surge in volatility and a directed market movement. If the core inflation does not meet economists' forecasts and remains high, one could bet on a more powerful downward correction of GBP/USD but do not expect it to be very prolonged. If the prices show a much greater decrease in June of this year, one can bet on further developing the bullish trend in GBP/USD.
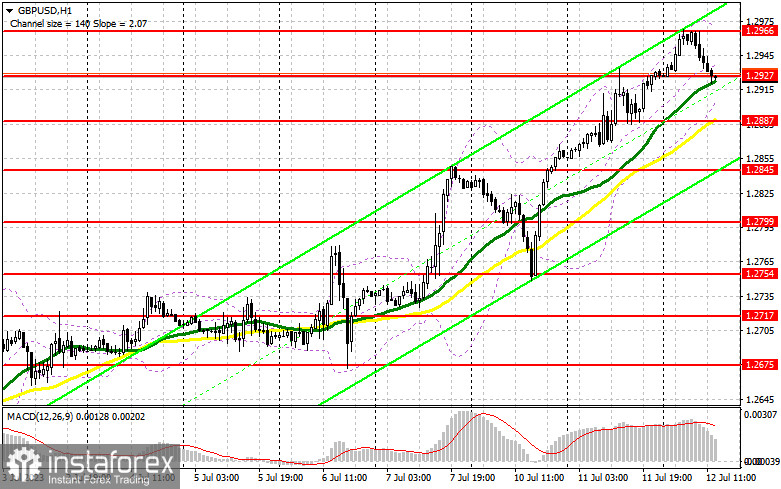
Buyers willing to purchase the pound around 1.2927 have appeared, but more is needed to reach new annual highs. A slight rollback up and return to 1.2927 hints at this. I prefer to open long positions in the second half of the day only after a decrease and the formation of a false breakout at 1.2887. This will be enough to receive a signal to buy the pound with the goal of a jerk upwards in the area of 1.2927. A breakout and consolidation above this range will form an additional signal to buy with a movement to 1.2966. The ultimate target will be the 1.3007 area, where I will lock in profits. In the scenario of a decrease in GBP/USD during the American session against the background of high inflation in the US and a lack of buyers at 1.2887, the pressure on the pound will increase, leading to a downward correction. In such a case, only the protection of the next area of 1.2845 and a false breakout will signal to open long positions. I plan to buy GBP/USD immediately on a rebound only from 1.2799, with a correction target of 30-35 points within the day.
To open short positions on GBP/USD, you need:
Sellers encountered strong resistance near the yearly high, but they needed high inflation in the US to solidify their positions. The pound will rise if the data indicates a decrease in price pressure. Therefore, I will only take action if there is a false breakout around 1.2966, following the same approach discussed earlier. This will serve as another selling signal, exerting pressure on GBP/USD and aiming to retest 1.2887, where the moving averages, favoring the bulls, are situated. The retest may occur if Federal Reserve representatives make hawkish remarks, and a breakout followed by a reverse test from below to above will significantly blow buyer positions, pushing GBP/USD towards 1.2845. Ultimately, my target remains the minimum of 1.2799, where I will take profit.
The bull market will continue in the case of GBP/USD growth and a lack of activity at 1.2966 in the second half of the day. In such a scenario, I will delay selling until the resistance at 1.3007 is tested. A false breakout at that level will provide an entry point for short positions. If there is no downward movement at that level, I will sell the pound immediately on a rebound from 1.3046, but only with the expectation of a downward correction of the pair by 30-35 points within the day.


Indicator signals:
Moving Averages
Trading is above the 30-day and 50-day moving averages, indicating further upward movement of the pair.
Note: The author considers the period and prices of the moving averages on the hourly chart (H1), which differs from the general definition of classical daily moving averages on the daily chart (D1).
Bollinger Bands
In the event of a decrease, the lower boundary of the indicator, around 1.2887, will act as a support level.
Description of indicators:
• Moving Average: Smooths out volatility and noise to determine the current trend. Period 50. Marked on the chart in yellow.
• Moving Average: Smooths out volatility and noise to determine the current trend. Period 30. Marked on the chart in green.
• MACD Indicator (Moving Average Convergence/Divergence): Fast EMA period 12. Slow EMA period 26. SMA period 9.
• Bollinger Bands: Period 20.
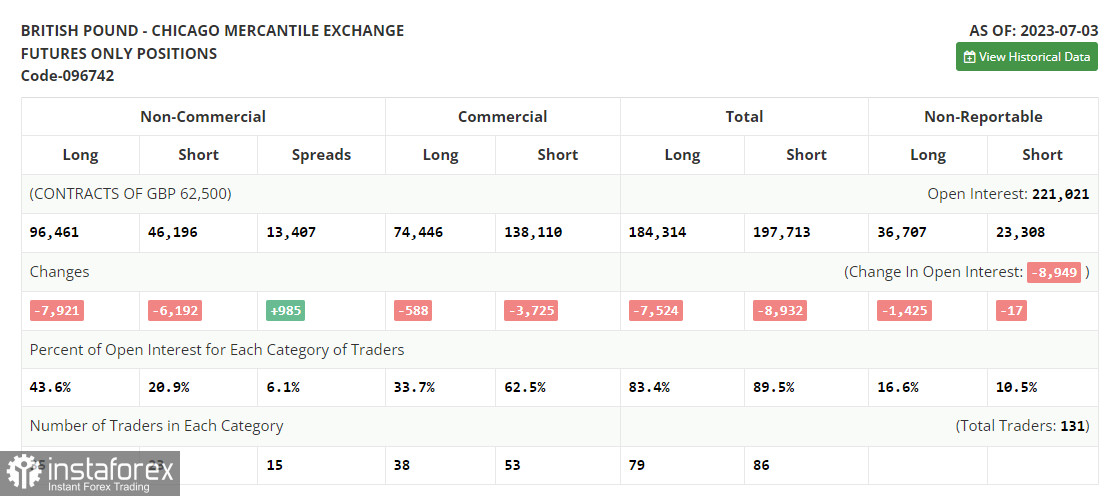
• Non-commercial traders: Speculators such as individual traders, hedge funds, and large institutions who use the futures market for speculative purposes and meet specific requirements.
• Long non-commercial positions represent the total open long positions of non-commercial traders.
• Short non-commercial positions represent the total open short positions of non-commercial traders.
• Non-commercial net position is the difference between short and long non-commercial positions.


