


EUR/USD
Higher timeframes
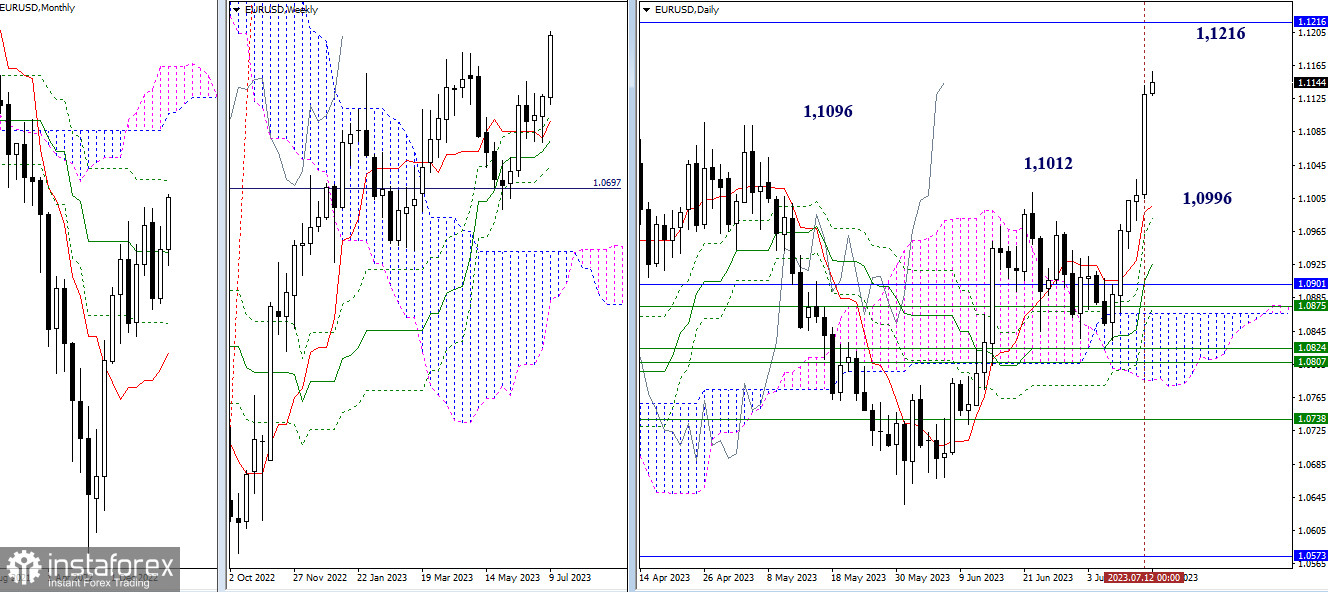
Bullish players again showed effectiveness yesterday and were able to update the high (1.1096), thereby restoring the weekly upward trend. Consolidation at the heights achieved and continuation of the rise will direct market attention to the final resistance of the monthly death cross of Ichimoku (1.1216). In case bears take the initiative, the passed levels of the weekly (1.1096) and daily (1.1012) corrections may provide support. The support for the daily short-term trend today is still lower at 1.0996.
H4 - H1
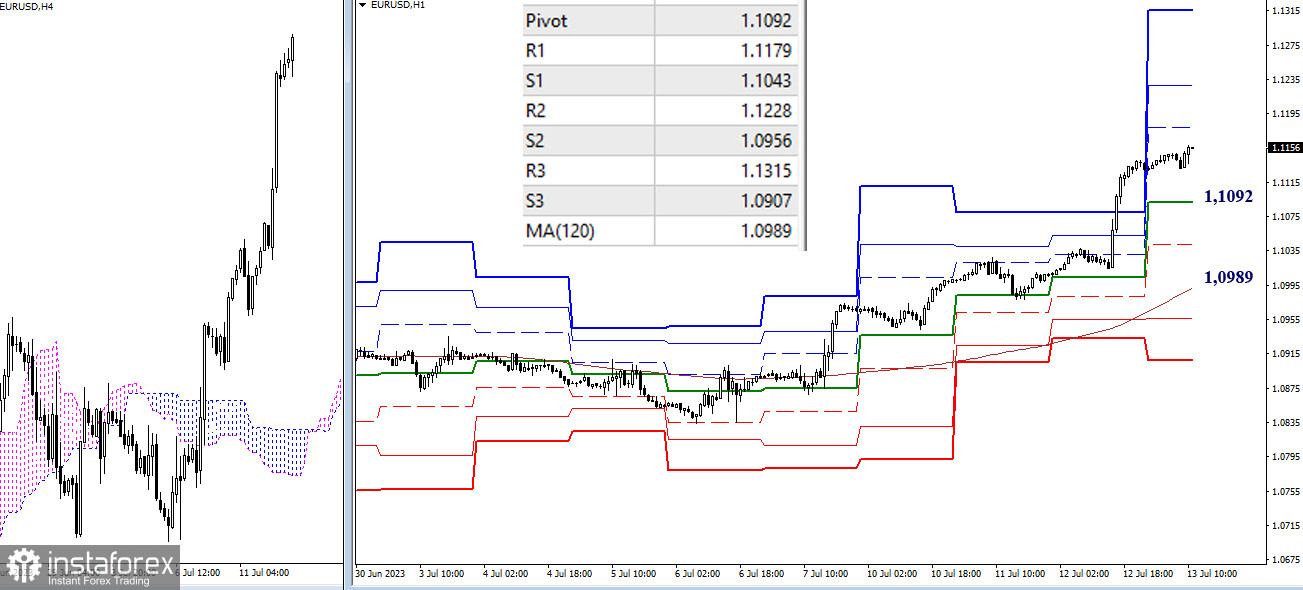
The effectiveness of yesterday's movement expanded the possibilities of classic pivot points for today. At the moment, the pair continues to rise. The resistance levels of the classic pivot points serve as upward targets within the day, located at 1.1179 - 1.1228 - 1.1315. The key levels of the lower timeframes currently serve as supports and, in case of a decline, the market will encounter them at 1.1092 (central pivot point of the day) and 1.0989 (weekly long-term trend), with intermediate support possibly at 1.1043 (S1).
***
GBP/USD
Higher timeframes
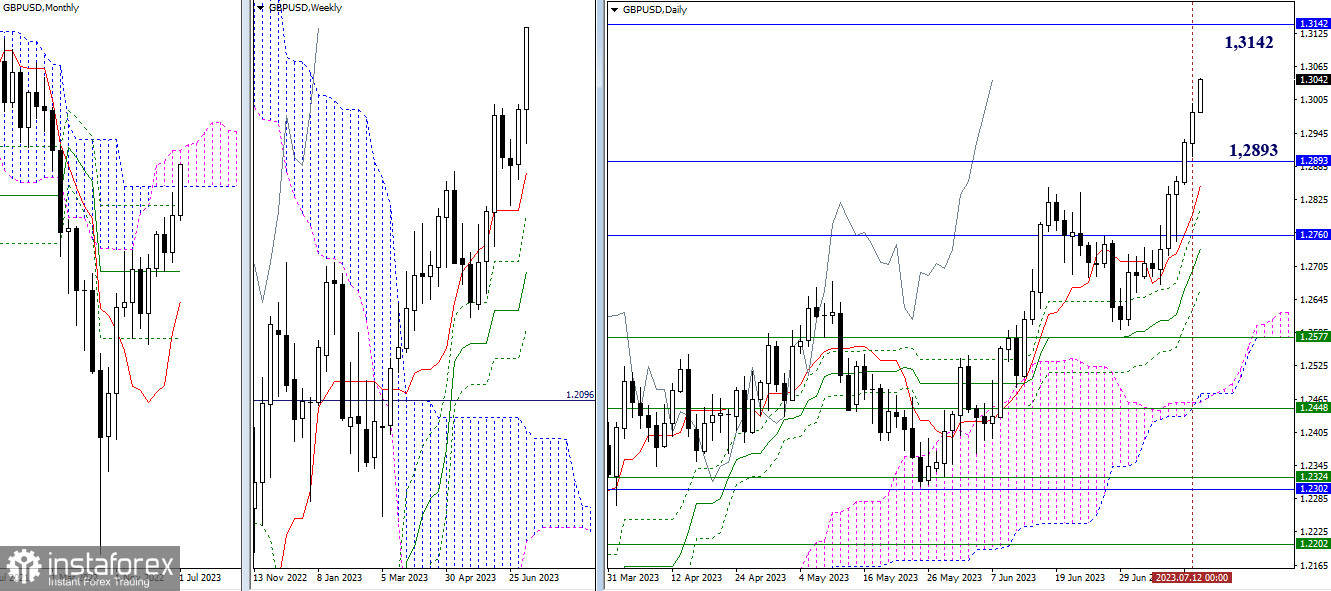
The pair previously entered the monthly cloud and is currently continuing to rise. The lower border of the cloud (1.2893) was unable to provide the proper resistance and remained as a possible support, should the market leader change. Working in the monthly bullish cloud, the bulls are now focused on its upper border (1.3142). A breakout of the cloud will allow for the formation of a new upward target.
H4 - H1
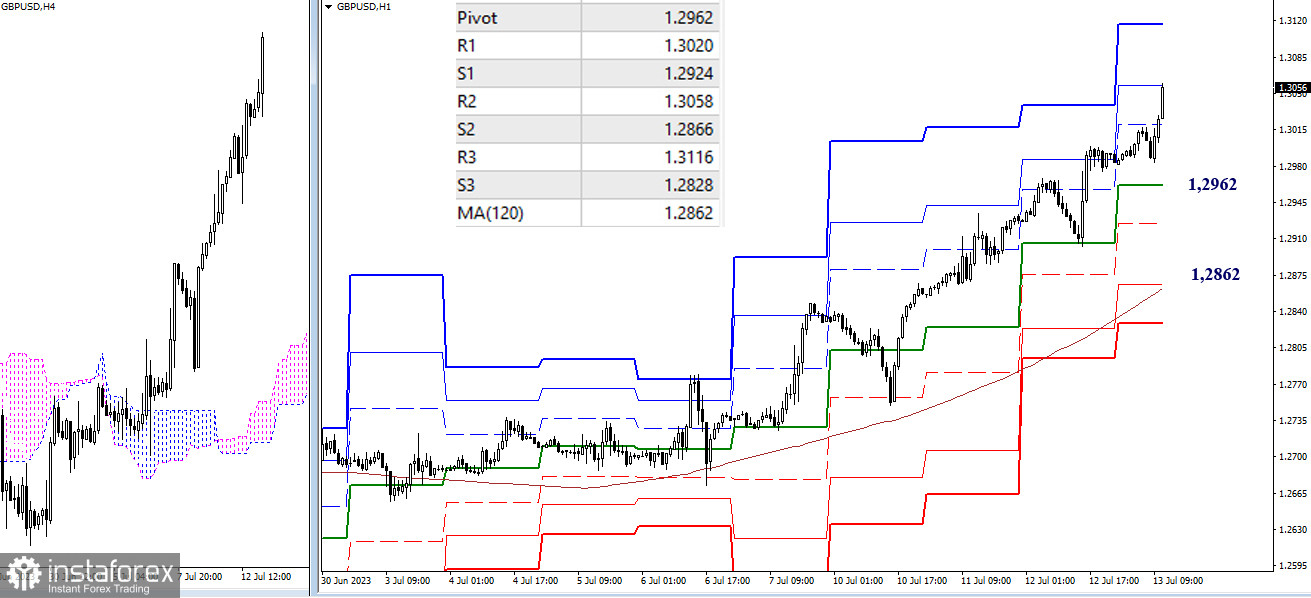
On the lower timeframes, bulls have the advantage and are developing an upward trend, with intraday targets at the resistance levels of the classic pivot points (1.3058 - 1.3116). The key levels today are significantly distant from the price chart, located at 1.2962 (central pivot point of the day) and 1.2862 (weekly long-term trend), which means that a corrective decline may have ample opportunities.
***
The technical analysis of the situation uses:
Higher timeframes - Ichimoku Kinko Hyo (9.26.52) + Fibo Kijun levels
Lower timeframes - H1 - Pivot Points (classic) + Moving Average 120 (weekly long-term trend)


