


Analysis of GBP/USD 5M.
The GBP/USD pair showed a meteoric rise yesterday. It extended its winning streak without a downward correction. Before Wednesday, traders anticipated inflation figures. After Wednesday, they digested the results. There were no other drivers this week. Most of the UK economic reports turned out to be weak. However, there were only few external negative reports. Traders ignored them, opening more long positions on the pound sterling. Perhaps they went long amid growing risk appetite. The price is already located not far from the lines of the Ichimoku indicator and the trend line. The pound sterling is growing every day without any concretion.
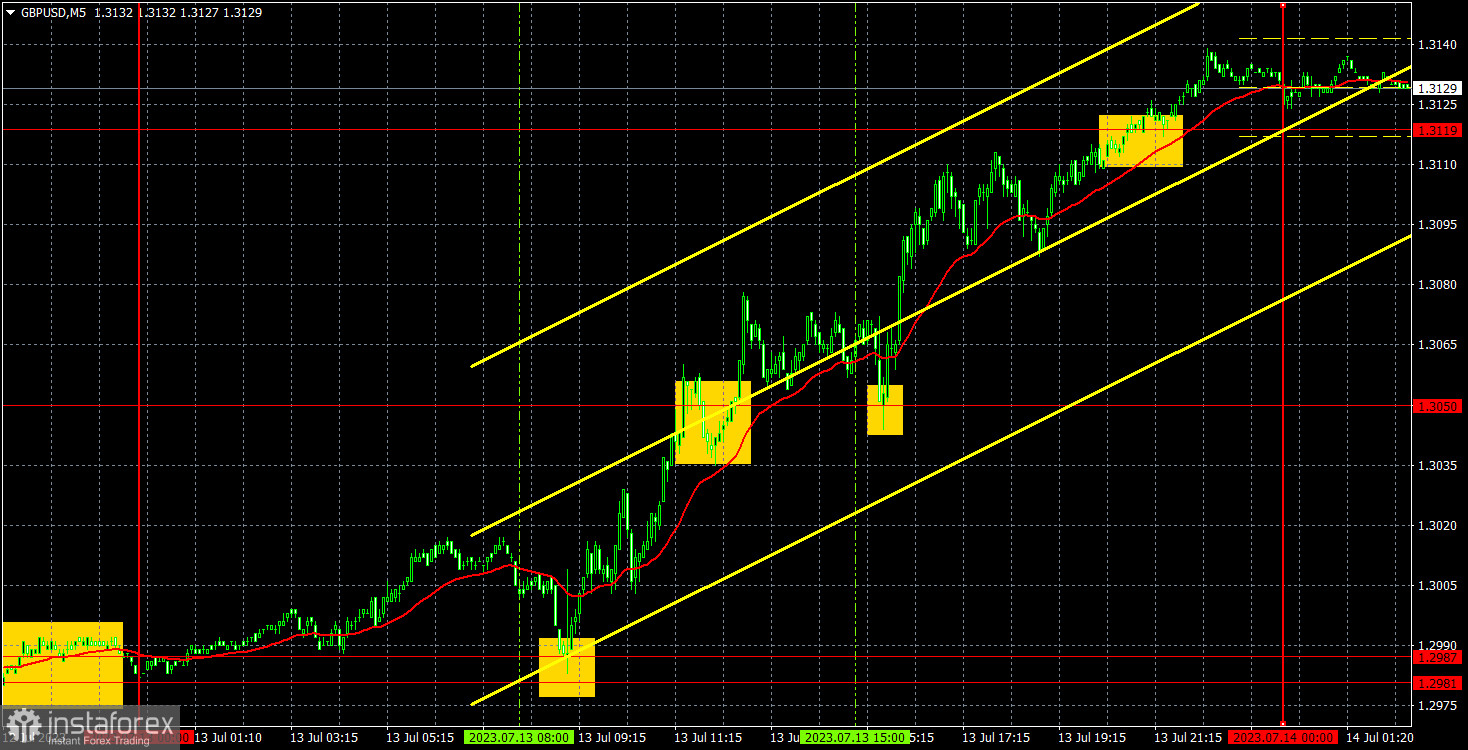
Despite the lack of fundamental drivers, technical signals indicate further growth. The pair retains an upward movement. So, traders increase long positions and make a profit. Yesterday, early in the morning, there was a buy signal in the range of 1.2981-1.2987. After that, the pair rose to 1.3050 and 1.3119. Thus, only one transaction should have been opened. The profit totaled 100 pips.
COT report:
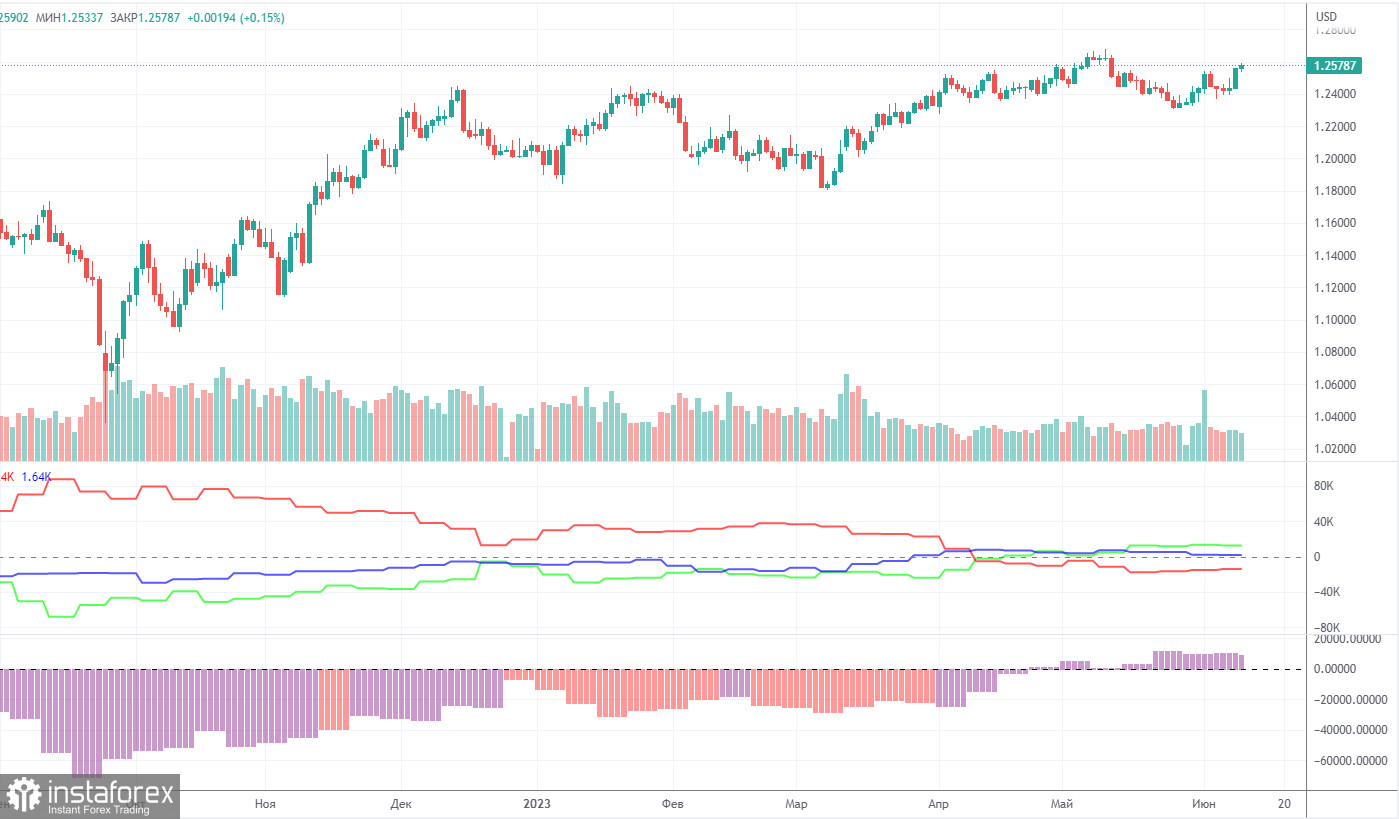
According to the latest report, the non-commercial group of traders closed 7,900 long positions and 6,100 short ones. Thus, the net position of non-commercial traders decreased by 1,800 positions in a week but in general it continued to rise. The net position has been steadily growing over the past 10 months as well as the pound sterling. Now, the net position has advanced markedly. This is why the pair will hardly maintain its bullish momentum. I believe that a long and protracted downward movement should begin. COT reports signal a slight growth of the British currency but it will not be able to rise in the long term. There are no drivers for opening new long positions. However, there are no technical signals for short positions yet.
The British currency has already grown by a total of 2,500 pips.
Without a downward correction, the continuation of the uptrend will be illogical. The Non-commercial group of traders has opened 96,500 long positions and 46,100 short ones. Such a gap means the end of the uptrend. I remain skeptical about the long-term growth of the pound sterling but speculators continue to buy because the pair is growing. Usually, BTC shows such movements.
Analysis of GBP/USD 1H.
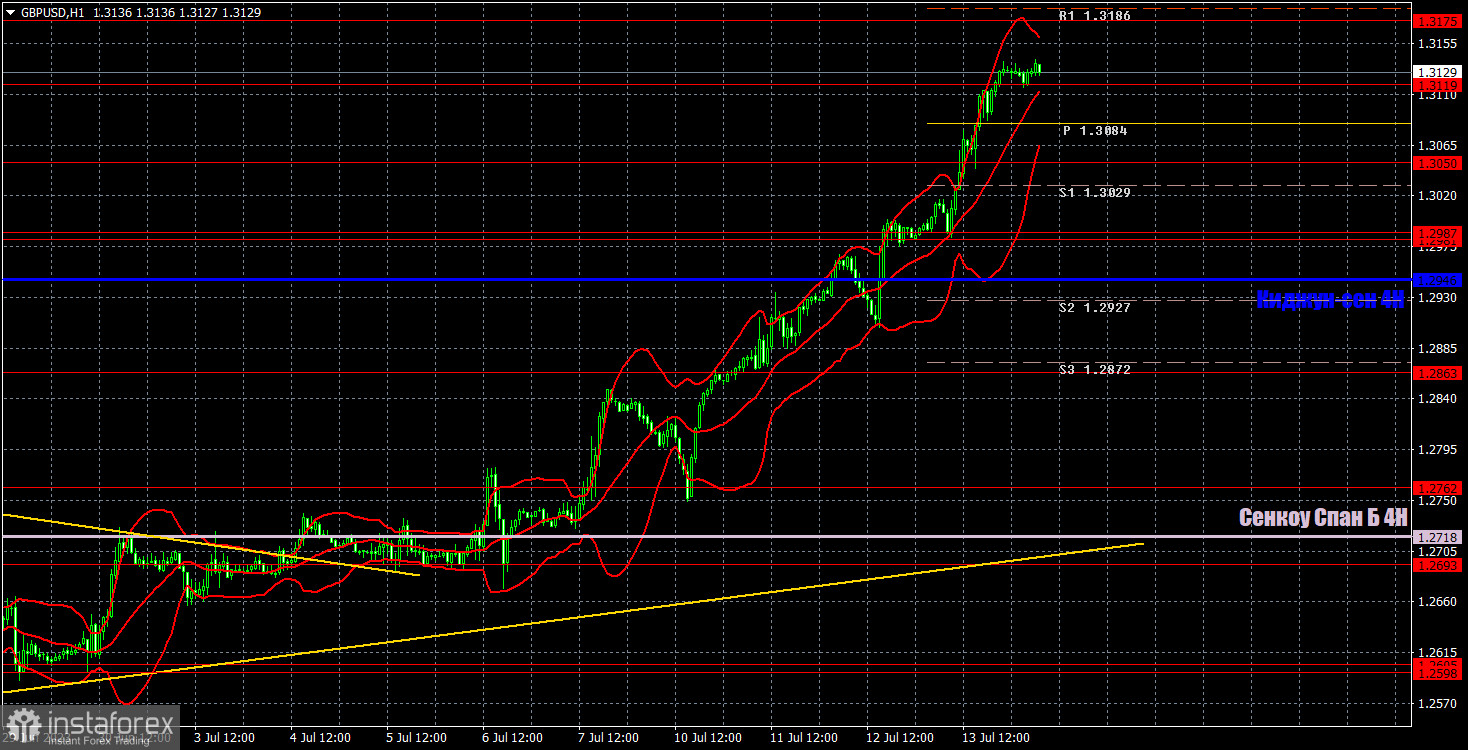
On the 1H timeframe, the pound/dollar pair maintains an upward trend. It is raising rather rapidly. According to technical indicators, the pound sterling is likely to climb higher. Traders also use every opportunity to sell the US dollar. There are no signs of the end of an uptrend. Naturally, such a movement cannot last forever. Is very difficult to say when the correction will begin as traders prefer to ignore macro stats.
On July 14, traders should pay attention to the following key levels: 1.2693, 1.2762, 1.2863, 1.2981-1.2987, 1.3050, 1.3119, 1.3175, 1.3222, 1.3273. Senkou Span B (1.2718) and Kijun-sen (1.2946) lines can also provide signals, e.g. rebounds and breakout of these levels and lines. It is recommended to set the Stop Loss orders at the breakeven level when the price moves in the right direction by 20 pips. The lines of the Ichimoku indicator can move during the day, which should be taken into account when determining trading signals. There are support and resistance levels that can be used to lock in profits.
On Friday, the UK economic calendar is empty. The US will release only the University of Michigan Consumer Sentiment Index. Today, the impact of fundamental reports on the pair is likely to be weak. Nevertheless, a sharp decline could occur at any moment as the pair is growing even without corrections.
Description of the chart:
Support and resistance levels are thick red lines near which the trend may end. They do not provide trading signals;
The Kijun-sen and Senkou Span B lines are the lines of the Ichimoku indicator, plotted to the 1H timeframe from the 4H one. They provide trading signals;
Extreme levels are thin red lines from which the price bounced earlier. They provide trading signals;
Yellow lines are trend lines, trend channels, and any other technical patterns;
Indicator 1 on the COT charts is the net position size for each category of traders;
Indicator 2 on the COT charts is the net position size for the Non-commercial group.


