


Trend analysis (Fig. 1)
On Friday, the price may go down from 1.3131 (the close price of yesterday's daily candlestick) to the 14.5% retracement level of 1.3059 (blue dotted line). Once the price reaches this level, growth may extend.
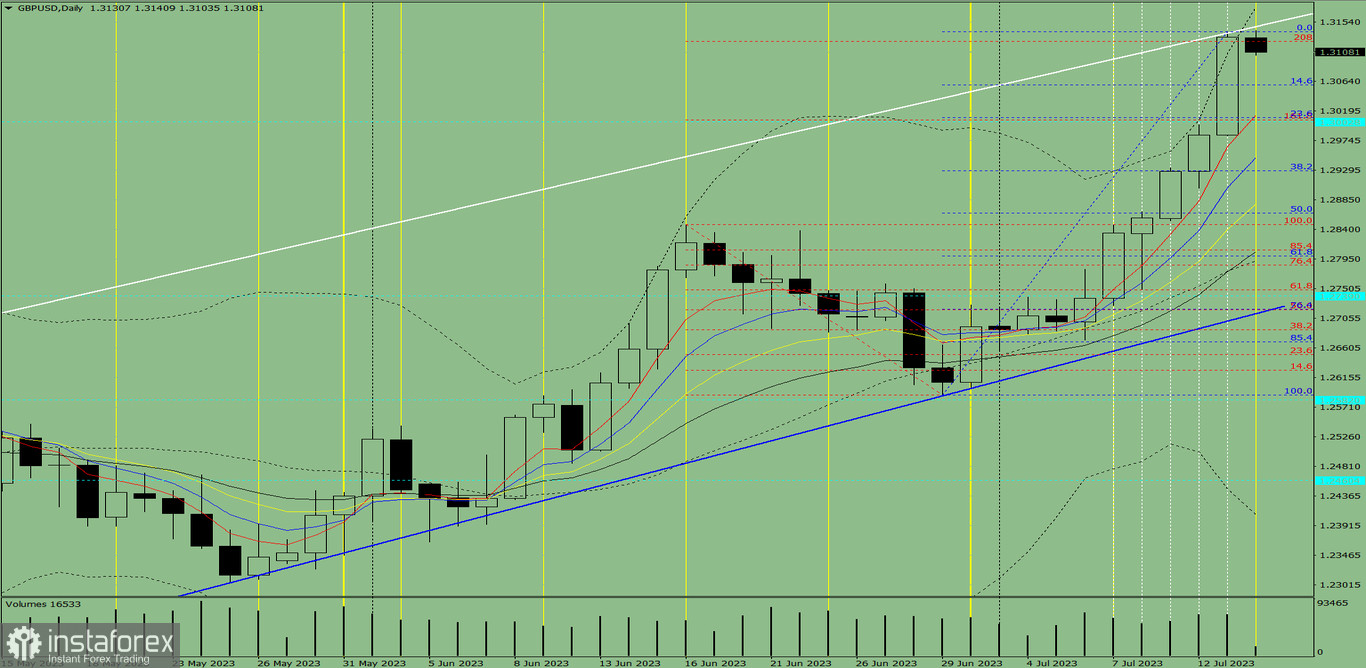
Fig. 1 (daily chart)
Complex analysis:
- indicator analysis - down
- Fibonacci levels - down
- volumes - down
- candlestick analysis - down
- trend analysis - up
- Bollinger bands - up
- weekly chart - up
Conclusion:
Today, the price may go down from 1.3131 (the close price of yesterday's daily candlestick) to the 14.5% retracement level of 1.3059 (blue dotted line). Once the price reaches this level, growth may extend.
Alternative scenario: the price may go down from 1.3131 (the close price of yesterday's daily candlestick) to the 23.6% retracement level of 1.3009 (blue dotted line). Once the price reaches this level, growth may extend.


