


GBP/USD Technical Analysis: A Rally Towards Resistance
Market Outlook
The GBP/USD pair experienced a notable recovery, rebounding from a local low of 1.2501. This low was characterized by a Pin Bar—a candlestick that indicates a potential reversal of price direction. Subsequently, the pair exhibited a strong rally, moving toward the technical resistance at 1.2601. During this ascent, the bulls successfully overcame resistance levels at 1.2547 and 1.2570, which now serve as the new foundational support levels for intraday trading.
The focus is now on the 50-day Moving Average (MA), which is currently positioned at 1.2597. Traders are watching this level closely, as surpassing it could signal a continued upward trend and solidify the short-term bullish sentiment for the GBP.
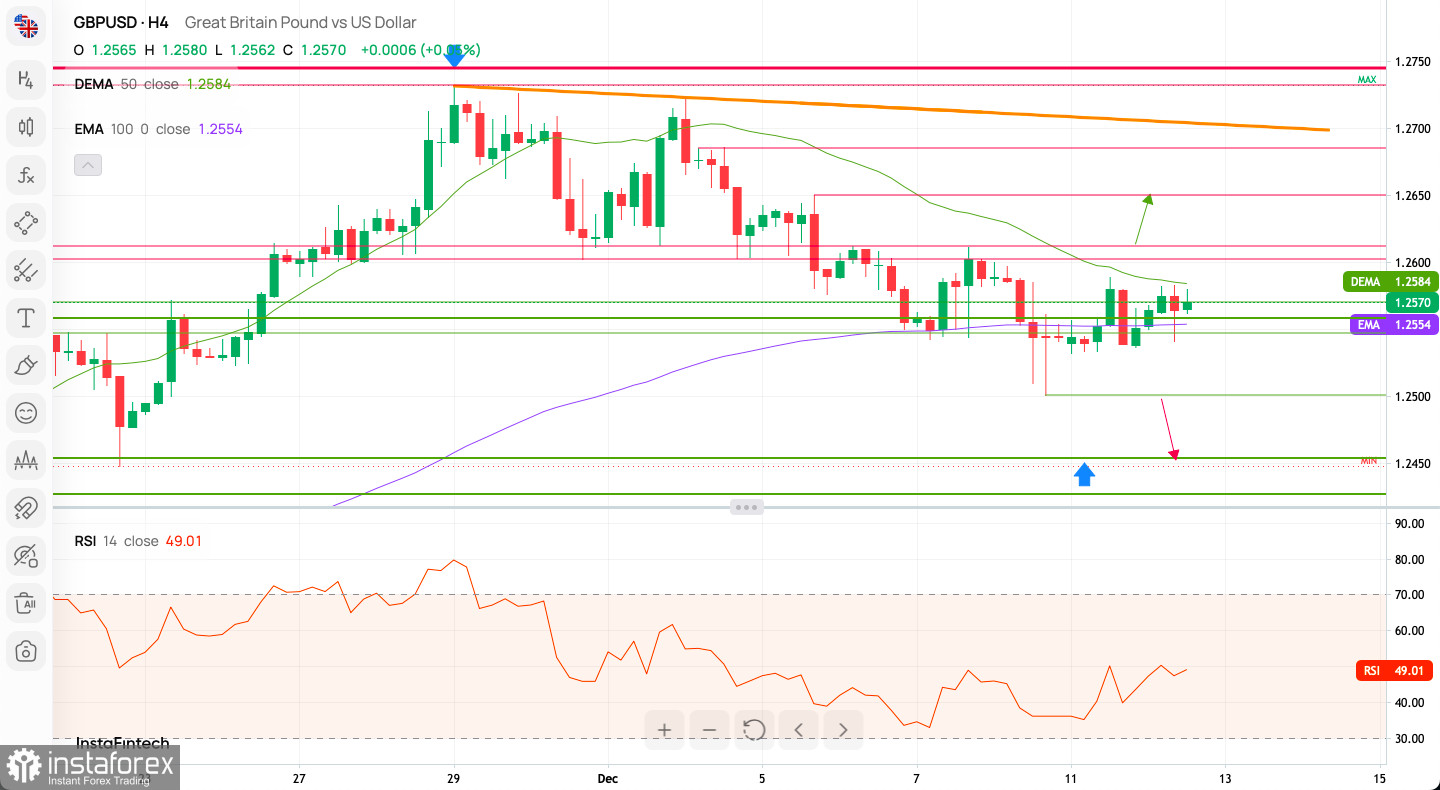
Moreover, the momentum indicator on the H4 timeframe has reflected a significant recovery from what was previously an extremely oversold market condition. This change in momentum is critical, as it suggests that the bearish trend is weakening and the bulls are gaining strength.
However, for the GBP to maintain its bullish stance, it's imperative for the price to break and hold above the key levels of 1.2602 and 1.2613. Such a move would not only reinforce the bullish trend but could also pave the way for the pair to test subsequent resistance levels. The short-term bullish outlook is contingent on these critical breakouts.
Traders should also consider external economic factors and geopolitical events that can influence the GBP/USD pair. Upcoming economic releases from both the UK and the US, such as GDP, inflation, and employment data, may significantly impact the pair's volatility and trend direction. As the market anticipates these events, cautious optimism seems to be the prevailing sentiment among investors.
Weekly Pivot Points
- WR3: 1.2905
- WR2: 1.2815
- WR1: 1.2682
- Weekly Pivot: 1.2592
- WS1: 1.2459
- WS2: 1.2369
- WS3: 1.2236
Trading Outlook
On the weekly chart, a Bullish Engulfing pattern has emerged, following a breakout above 1.2340, which underscores a bullish trend. The market trades above the 50 WMA and eyes the 100 WMA at 1.2504. A break below the significant support at 1.1802 could lead to a significant decline towards 1.1494.
Intraday Indicator Signals
- Buy Signals: 8 out of 21 technical indicators
- Neutral Signals: 11 indicators
- Sell Signals: 4 indicators
- Buy Signals: 0 out of 18 moving averages
- Sell Signals: All 18 moving averages
Sentiment Scoreboard
The current sentiment is predominantly bullish (58%), consistent with last week (53% bulls). However, the past three days have seen a neutral shift (50% bulls vs. 50% bears).
Useful Links
Important Reminder
The begginers in forex trading need to be very careful when making decisions about entering the market. Before the release of important reports, it is best to stay out of the market to avoid being caught in sharp market fluctuations due to increased volatility. If you decide to trade during the news release, then always place stop orders to minimize losses.
Without placing stop orders, you can very quickly lose your entire deposit, especially if you do not use money management and trade large volumes. For successful trading, you need to have a clear trading plan and stay focues and disciplined. Spontaneous trading decision based on the current market situation is an inherently losing strategy for a scalper or daytrader.


