


Analysis of Tuesday trades:
EUR/USD 30M chart
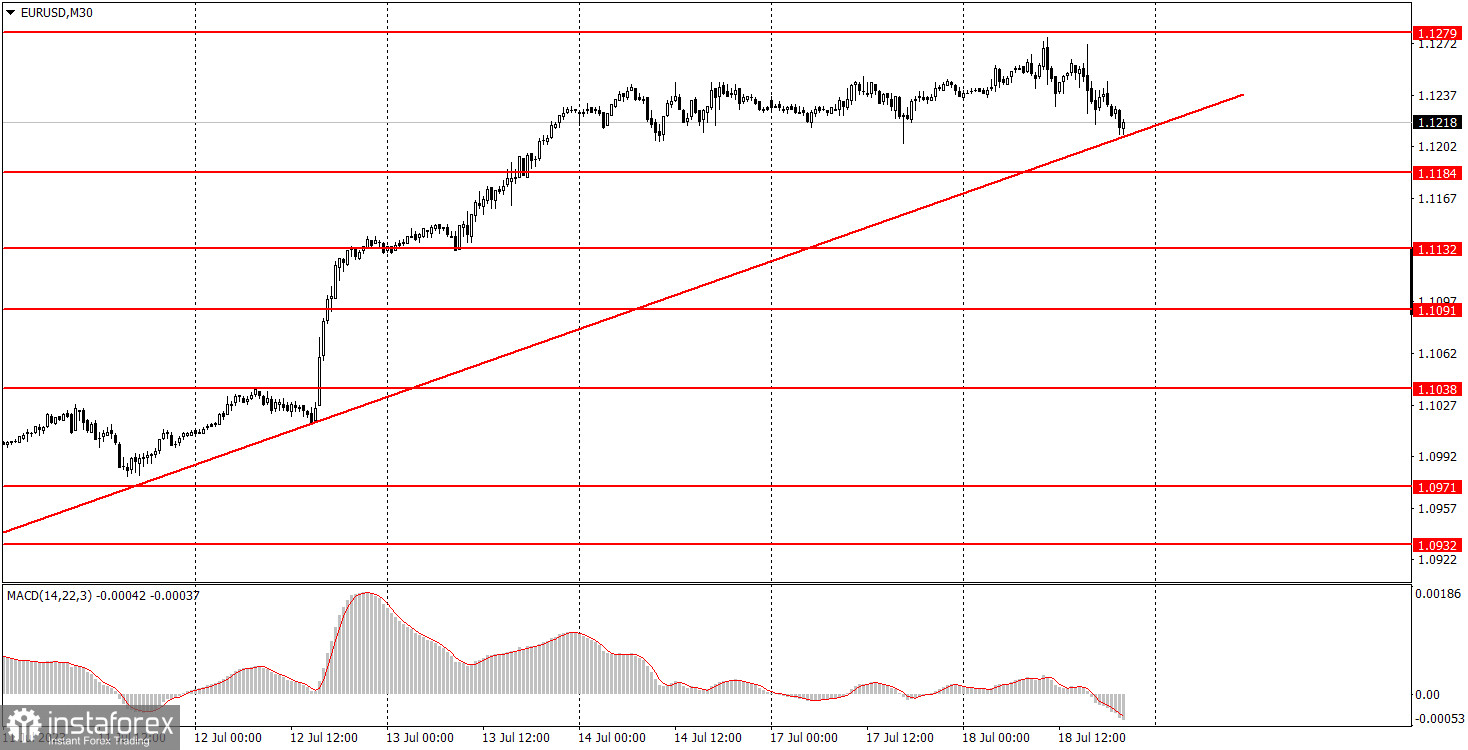
The EUR/USD pair continued trading mostly sideways during the second trading day of the week, with limited upward or downward movement. Volatility remained low, as the pair only fluctuated within a range of 65 pips throughout the day. Although not as low as the previous two days, it was still relatively low. Today, two reports were released in the United States, which were ignored by the market. Industrial production and retail sales turned out to be weaker than forecasts, but the dollar strengthened in the second half of the day. Thus, the market continues to disregard any fundamentals and behaves based on technical factors.
The uptrend is still intact, indicated by the ascending trend line. A rebound from this line could potentially trigger a new wave of growth for the pair. However, breaking above the range in a sideways market would not be a strong signal for a decline. Over the past three days, we have observed a flat market. The decline of the European currency has been anticipated for a while, but the market is still not rushing to sell or engage in active trading.
EUR/USD 5M chart
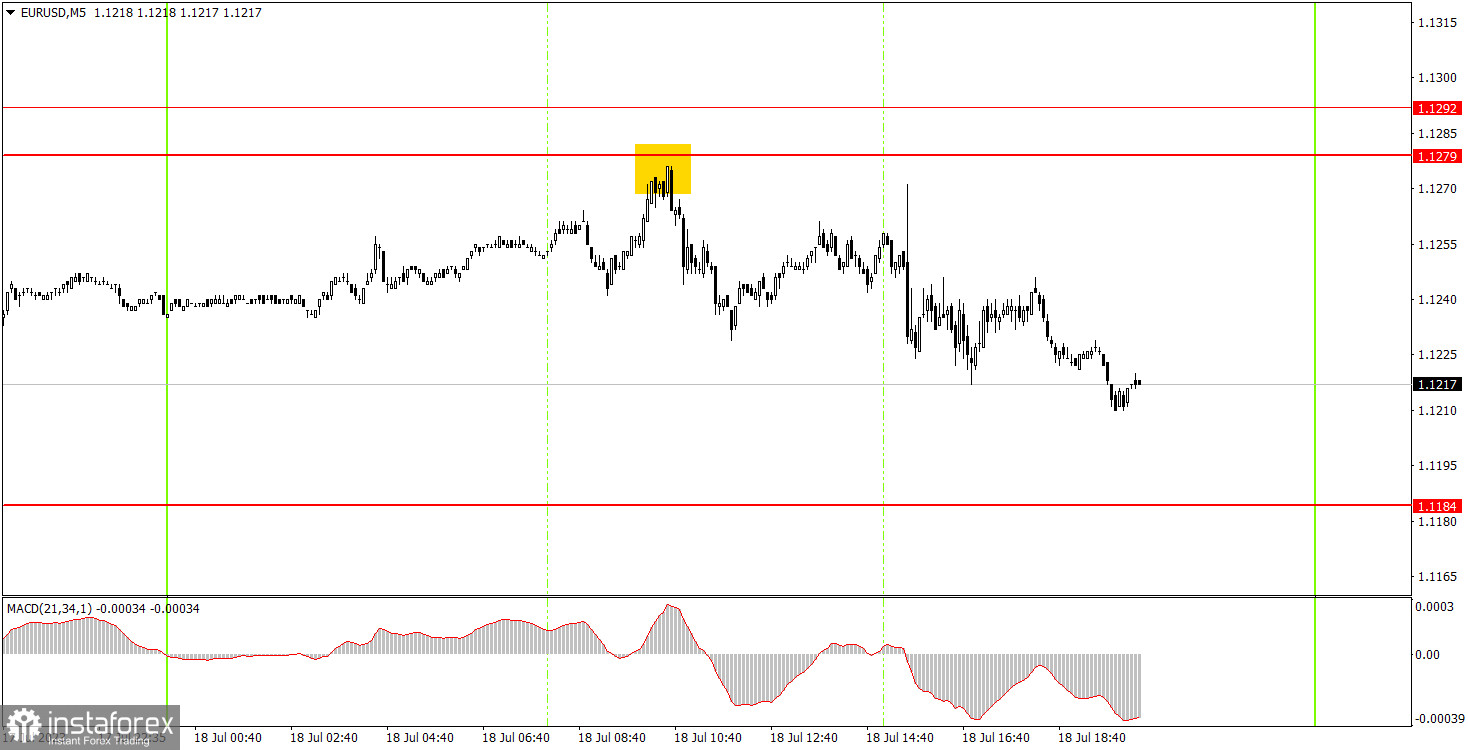
On Tuesday, only one sell signal appeared on the 5-minute time frame. At the beginning of the European trading session, the pair rebounded from the level of 1.1279 with a margin of three pips. If novice traders had entered a sell trade at that moment, they could have gained a profit of 30-40 pips, as the price subsequently continued to decline. However, the signal was ambiguous.
Trading strategy for Wednesday:
On the 30-minute timeframe, the pair continues to form an ascending trend. Friday and Monday provided excellent opportunities for minor corrections with an empty calendar of events, but the market chose not to take advantage of them. However, on Tuesday, the dollar experienced a slight correction against the macroeconomic background, which was expected to cause its further decline. But the market still lacks logic in its movements. The unfounded rise of the euro currency may continue this week. On the 5-minute time frame tomorrow, the key levels can be found at: 1.0901, 1.0932, 1.0971-1.0977, 1.1038, 1.1091, 1.1132, 1.1184, 1.1279-1.1292, 1.1330, and 1.1367. Once there is a 15-pip movement in the desired direction, a stop-loss order can be set to break even. On Wednesday, the Eurozone will publish the second estimate of the Consumer Price Index for June. It is unlikely to differ significantly from the first estimate, so we do not expect a strong market reaction to this report. In the United States, there will be two minor reports: Building Permits and Housing Starts.
Basic rules of a trading system:
1) The strength of the signal depends on the time period during which the signal was formed (a rebound or a break). The shorter this period, the stronger the signal.
2) If two or more trades were opened at some level following false signals, then any consequent signals near this level should be ignored.
3) During the flat trend, any currency pair may form a lot of false signals or do not produce any signals at all. In any case, the flat trend is not the best condition for trading.
4) Trades are opened in the time period between the beginning of the European session and until the middle of the American one when all deals should be closed manually.
5) We can pay attention to the MACD signals in the 30M time frame only if there is good volatility and a definite trend confirmed by a trend line or a trend channel.
6) If two key levels are too close to each other (about 5-15 pips), then this is a support or resistance area.
How to read charts:
Support and Resistance price levels can serve as targets when buying or selling. You can place Take Profit levels near them.
Red lines are channels or trend lines that display the current trend and show which direction is better to trade.
MACD indicator (14,22,3) is a histogram and a signal line showing when it is better to enter the market when they cross. This indicator is better to be used in combination with trend channels or trend lines.
Important speeches and reports that are always reflected in the economic calendars can greatly influence the movement of a currency pair. Therefore, during such events, it is recommended to trade as carefully as possible or exit the market in order to avoid a sharp price reversal against the previous movement.
Beginning traders should remember that every trade cannot be profitable. The development of a reliable strategy and money management are the key to success in trading over a long period of time.


