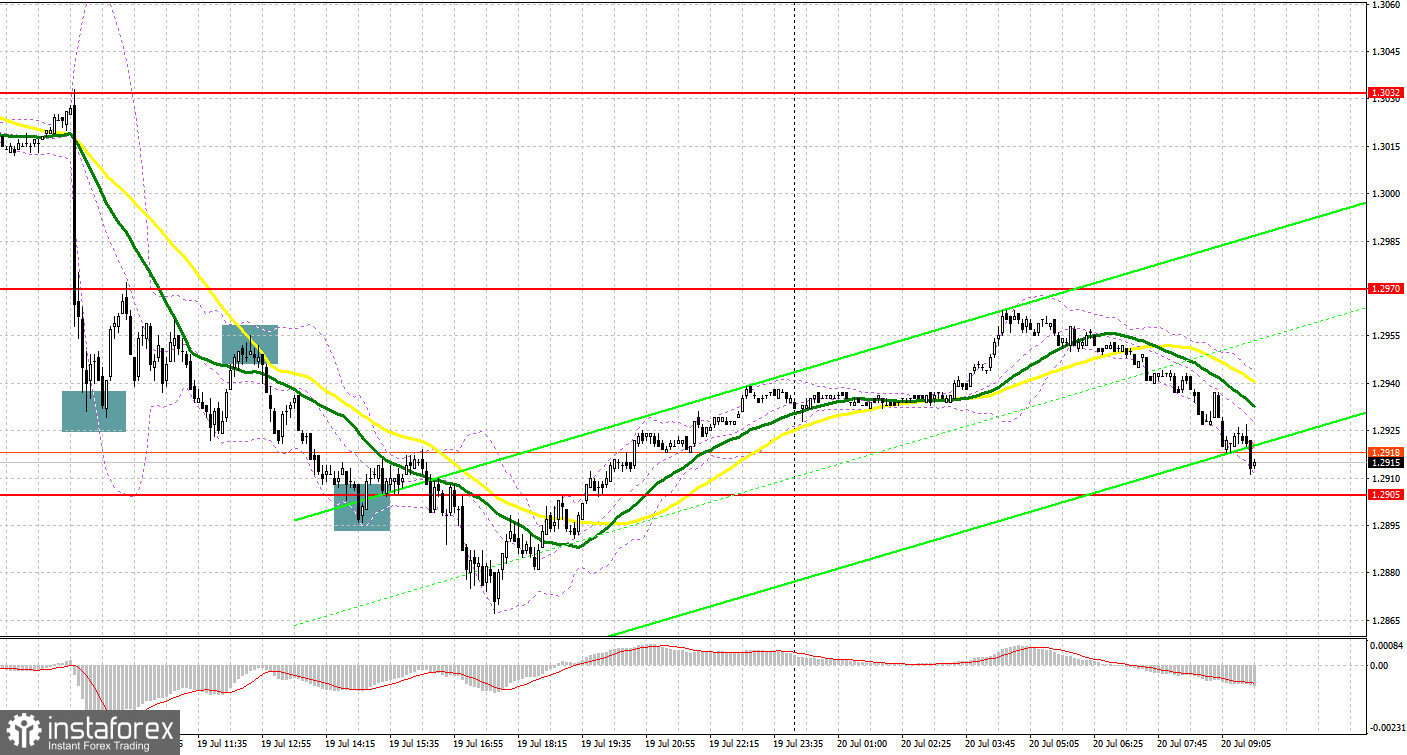
Yesterday, GBP/USD formed several market entry signals. Let's look at the 5-minute chart and see what happened there. In my previous forecast, I paid attention to the level of 1.2947 and recommended making decisions on entering the market from it. The sharp fall of the pound in the first half of the day and a false breakdown at 1.2947 generated a buy signal. The price had an upward movement of only 20 pips. Then, the currency pair came again under pressure. The break and reverse test of 1.2947 gave a great sell signal. As a result, GBP/USD dropped by more than 40 pips. Sluggish attempts by the bulls to defend 1.2905 did not bring notable results in the afternoon.

What is needed to open long positions on GBP/USD
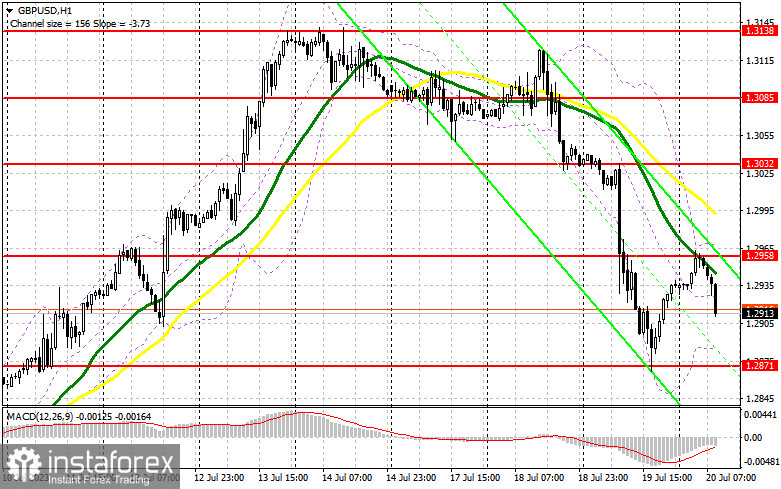
Inflation in the UK slackened off sharply. This is certainly bearish for the British pound, which has been recently strongly overbought. The economic calendar is empty today. So, the instrument will continue the downward movement. Thus, I advise the buyers to act very carefully. Only on condition of a decline to the area of large support 1.2871, formed yesterday, and a false breakout there, I will open long positions, betting on the sharp move upwards to the area of the nearest resistance at 1.2958, where the average moving averages play on the side of the sellers. A break and consolidation above this range create an extra buy signal with a move to 1.3032, which recoups most of yesterday's losses. The most distant target will be resistance 1.3085, where I will take profits.
Bearing in mind a scenario of a decline to 1.2871 and in case buyers are inactive there, the pound will continue to fall as part of a downward correction that can develop into a real bearish trend. In this case, only protection of the next area 1.2807 and a false breakdown on it will give a signal to open long positions. I plan to buy GBP/USD immediately on a dip only from 1.2754 with the aim of correcting 30-35 points within a day.

What is needed to open short positions on GBP/USD
The bears are still setting the tone after yesterday's slight correction of the instrument. The most important task today for the first half of the day will be to protect the resistance at 1.2958, where the moving averages are passing, playing on the side of the sellers. In case the price goes up, only a false breakdown at this level will provide an excellent sell signal during the downward correction with the target at 1.2871, which will increase pressure on GBP/USD. A break and reverse test from the bottom to the top of this range will deal a more serious blow to the buyers' positions, giving the opportunity for a larger decline in GBP/USD and pushing the price to 1.2807. The lowest target remains at least 1.2754, where I will take profits.
With GBP/USD rising and no activity at 1.2958, sellers' confidence may be shaken. Indeed, we cannot rule out that the decline in inflation last month only will be enough for the Bank of England to seriously revise its aggressive monetary policy. In this case, I will postpone opening short positions until the test of resistance at 1.3032. A false breakout there will provide an entry point to short positions. If there is no downward movement, I will sell the pound immediately at a rebound immediately from 1.3085, bearing in mind a correction down by 30-35 points within the day.
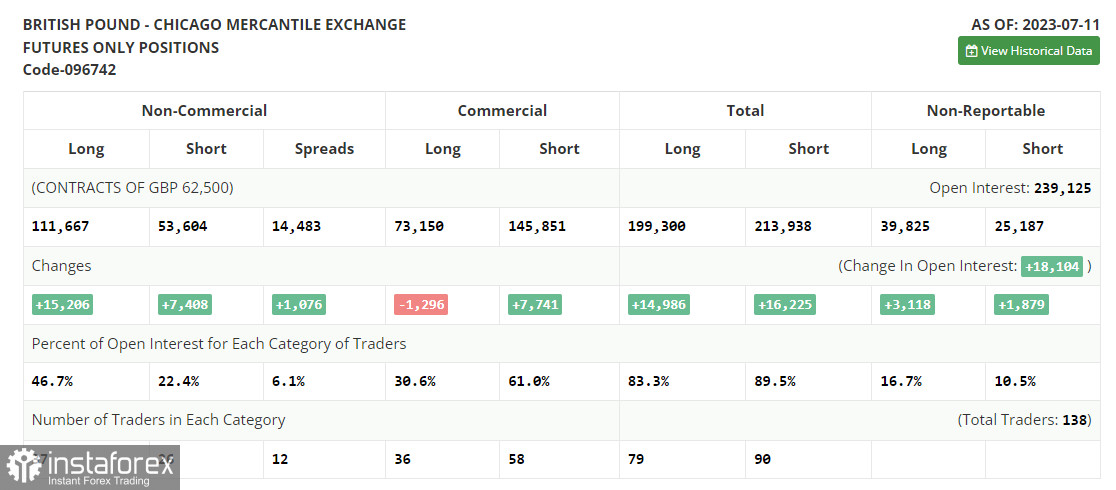
In the COT report (Commitment of Traders) for July 11, there was an increase in both long and short positions. However, buyers turned out to be twice as many, which confirmed the bull market that we have been seeing throughout this month. Buyers of the pound definitely have every chance to go ahead more aggressively. On the one hand, the Federal Reserve is pleased with the rapid fall in inflation, which reduces the likelihood of further rate hikes. On the other hand, the Bank of England, despite all economic woes, has to maintain a policy of high interest rates due to serious problems with inflation, affecting households' living standards.
The difference in monetary policies will lead to the strengthening of the pound and the weakening of the US dollar. Buying GBP/USD on dips remains the best strategy. The latest COT report said long non-commercial positions rose by 15,206 to 111,667 from 96,461, while short non-commercial positions increased only by 7,408 to 53,604 from 46,196. As a result, net commercial positions jumped to the level of 58,063 against 50,265 a week earlier. GBP/USD closed last week higher at 1.2932 against 1.2698 a week ago.

Indicators' signals
Moving Averages
The instrument is trading below the 30 and 50-day moving averages. It indicates a further downward correction of the instrument.
Note: The period and prices of the moving averages are considered by the analyst on the 1-hour chart and differ from the general definition of classic daily moving averages on the daily chart.
Bollinger Bands
In case GBP/USD extends its decline, the indicator's lower border around 1.2875 will act as resistance.
Description of indicators
- Moving average (moving average, determines the current trend by smoothing out volatility and noise). Period 50. It is marked yellow on the chart.
- Moving average (moving average, determines the current trend by smoothing out volatility and noise). Period 30. It is marked green on the chart.
- MACD indicator (Moving Average Convergence/Divergence — convergence/divergence of moving averages) Quick EMA period 12. Slow EMA period to 26. SMA period 9
- Bollinger Bands (Bollinger Bands). Period 20
- Non-commercial speculative traders, such as individual traders, hedge funds, and large institutions that use the futures market for speculative purposes and meet certain requirements.
- Long non-commercial positions represent the total long open position of non-commercial traders.
- Short non-commercial positions represent the total short open position of non-commercial traders.
- Total non-commercial net position is the difference between short and long positions of non-commercial traders.


