


EUR/USD
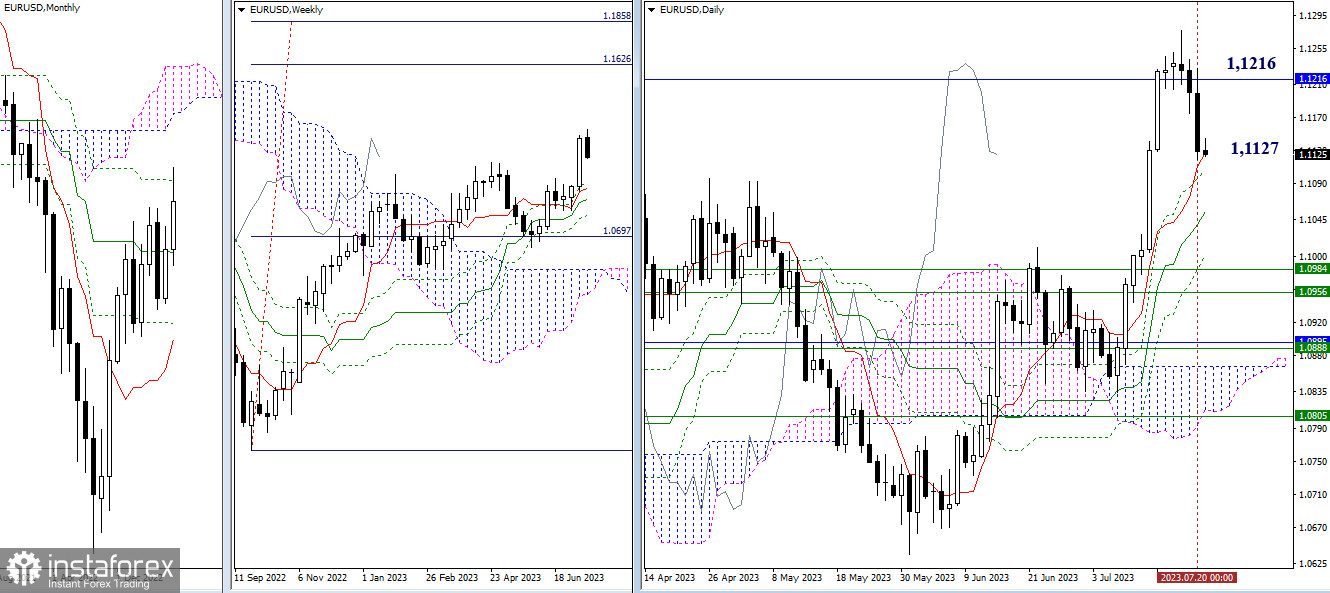
Higher timeframes
Yesterday, bearish players continued the decline and reached the support of the daily short-term trend (1.1127). In case of breaking through, further decline will proceed through other supports of the daily Ichimoku cross (1.1107 – 1.1055 – 1.1003) to the weekly levels at 1.0984 – 1.0956. If the market sees a return of bullish players, their targets on the current chart segment will be the final level of the monthly Ichimoku cross (1.1216) and the high of the current correction (1.1276).
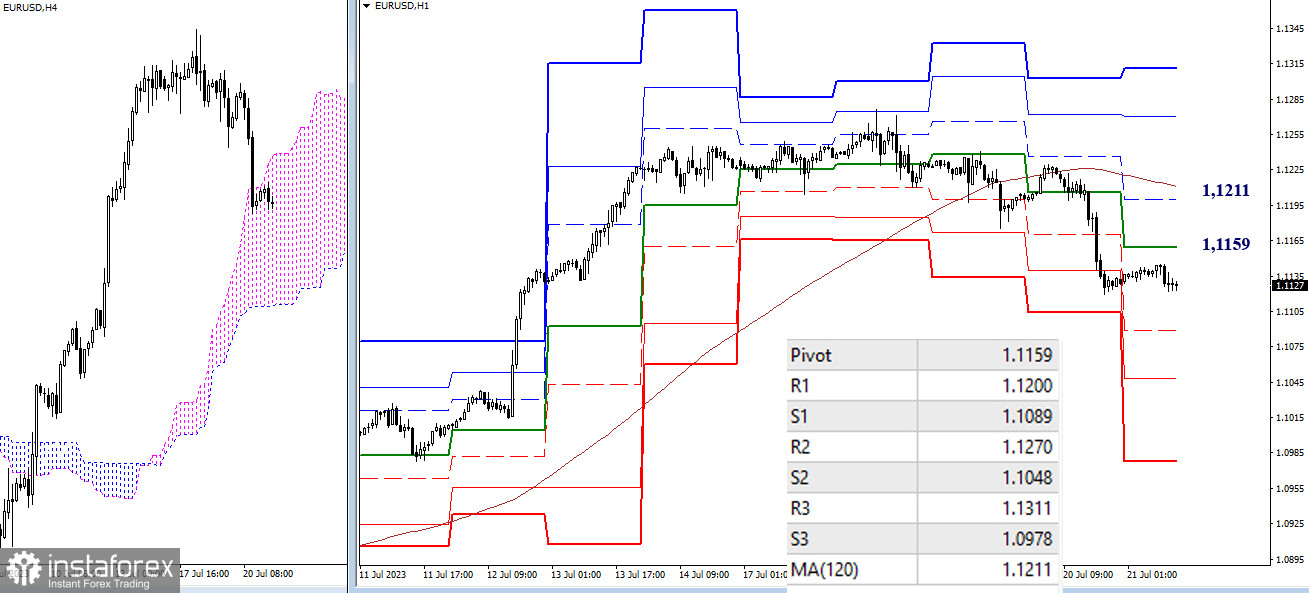
H4 – H1
On the lower timeframes, the advantage currently belongs to bearish players. Intraday targets for the downside are the classic pivot points (1.1089 – 1.1048 – 1.0978). The key levels on the lower timeframes will act as resistance today. If the correction develops, they will encounter the pair at 1.1159 (central pivot point of the day) and 1.1211 (weekly long-term trend). A consolidation above these levels can change the current balance of power.
***
GBP/USD
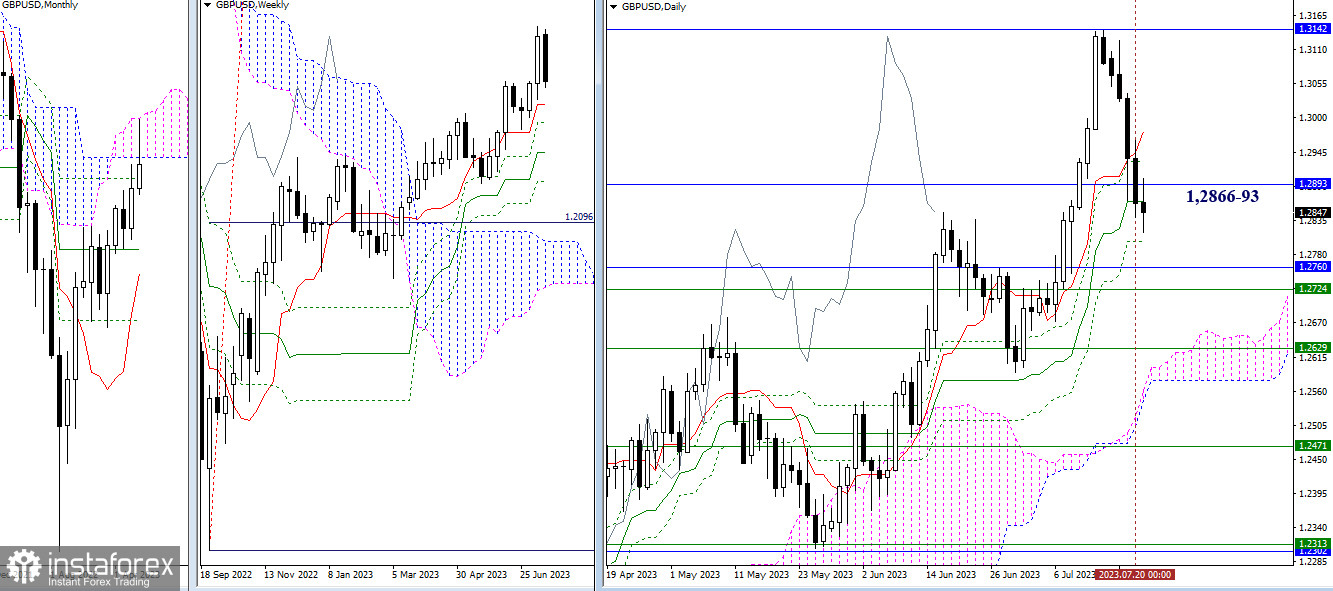
Higher timeframes
Bearish players continue the decline. Attracting and influencing factors in the near future may still be 1.2866 (daily medium-term trend) and 1.2893 (lower boundary of the monthly cloud). If the decline continues, the next support levels are currently located at different timeframes at 1.2800 – 1.2760 – 1.2724.
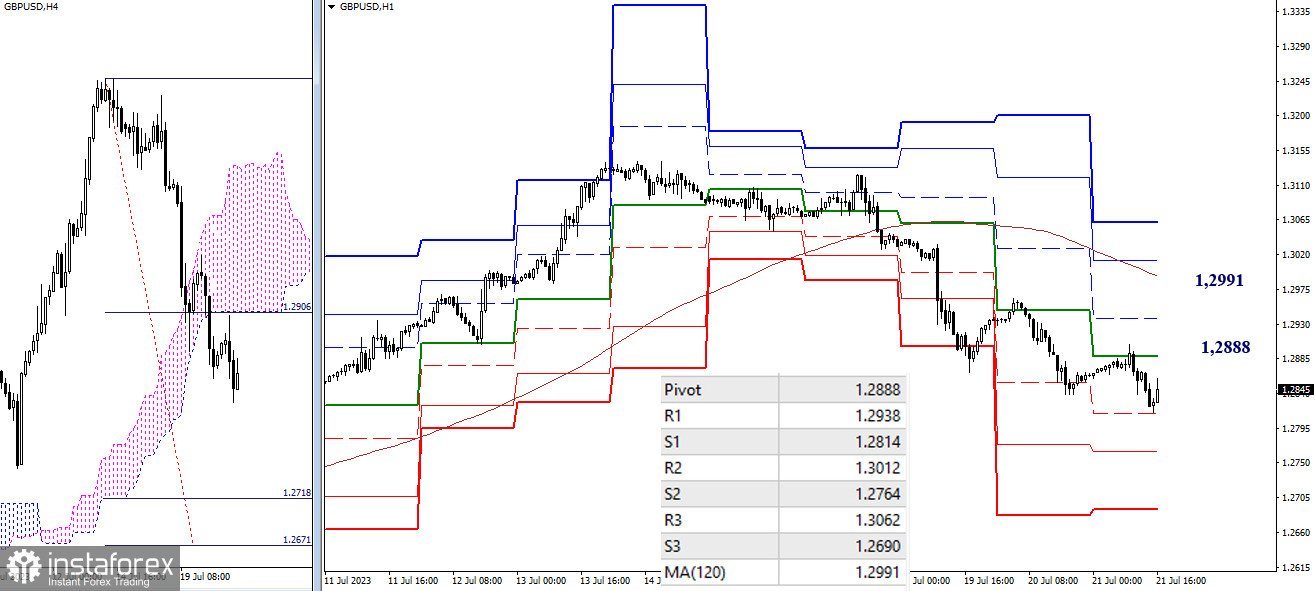
H4 – H1
On the lower timeframes, the first support of the classic pivot points has been tested (1.2814), followed by 1.2764 (S2) and 1.2690 (S3), with the current target being the target for the breakdown of the H4 cloud (1.2718 – 1.2671). The key levels today act as resistances and are located at 1.2888 (central pivot point of the day) and 1.2991 (weekly long-term trend).
***
The technical analysis of the situation uses:
Higher timeframes - Ichimoku Kinko Hyo (9.26.52) + Fibo Kijun levels
Lower timeframes - H1 - Pivot Points (classic) + Moving Average 120 (weekly long-term trend)


