Long-term perspective.

The GBP/USD currency pair experienced only minimal losses during the current week. This outcome can be understood from two perspectives. First, it is logical since the ECB meeting and the euro's decline do not directly impact the British pound. Second, historically, there has been a strong correlation between the euro and the pound. Consequently, it remains evident that the pound continues to exhibit significantly stronger growth than the euro and shows great reluctance to undergo any notable correction. This behavior could be attributed to the Bank of England's more assertive monetary approach. However, it's worth noting that the Federal Reserve's interest rate is also rising and currently surpasses that of the BOE. We have repeatedly pointed this out to traders. Thus, the GBP/USD pair's lack of a significant correction appears illogical and unjustified.
The danger for the dollar arises from the market's inexplicable ignorance towards it and the potential hints of a softer monetary policy by the Federal Reserve towards year-end. Inflation in the United States has already decreased to 3%, and core inflation may catch up by the end of the year, indicating a reduced necessity for maintaining high-interest rates. Meanwhile, the Bank of England will likely have to retain its rates at maximum levels for a prolonged period to approximate the target inflation level. If the market pays little attention to the dollar, it may trigger a strong wave of selling towards the end of the year.
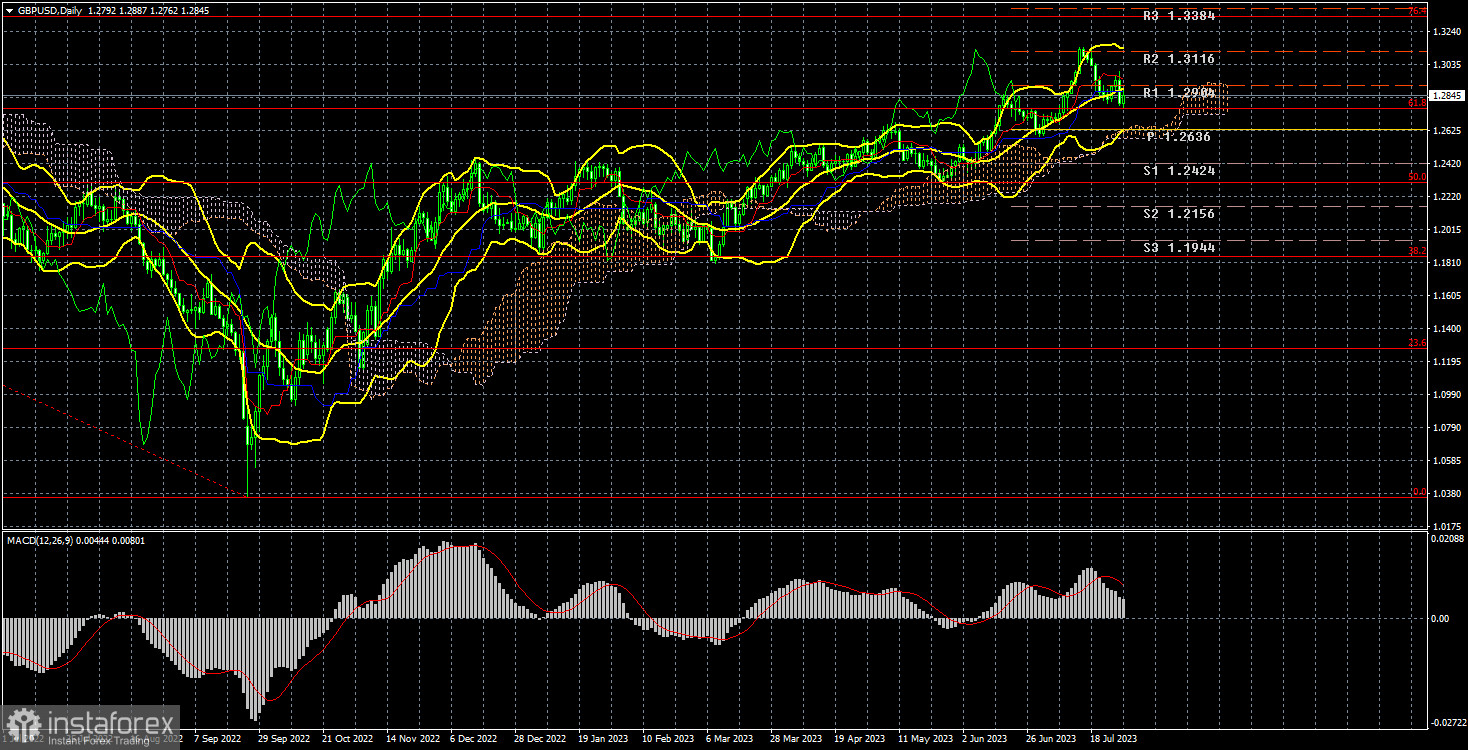
Hence, despite the desire for corrections, the objective reality suggests that, given the market's current attitude towards the fundamental backdrop, the dollar may continue to decline for an extended period. On the 24-hour timeframe, the pair have barely settled below the critical line, and the total decline from the recent peak is an "unreal" 300 points. It has yet to manage to stabilize below the 61.8% Fibonacci level. Currently, we do not see any signs of the upward trend ending. Some indications are present on lower timeframes but could be attributed to a simple correction or pullback.
COT Analysis.

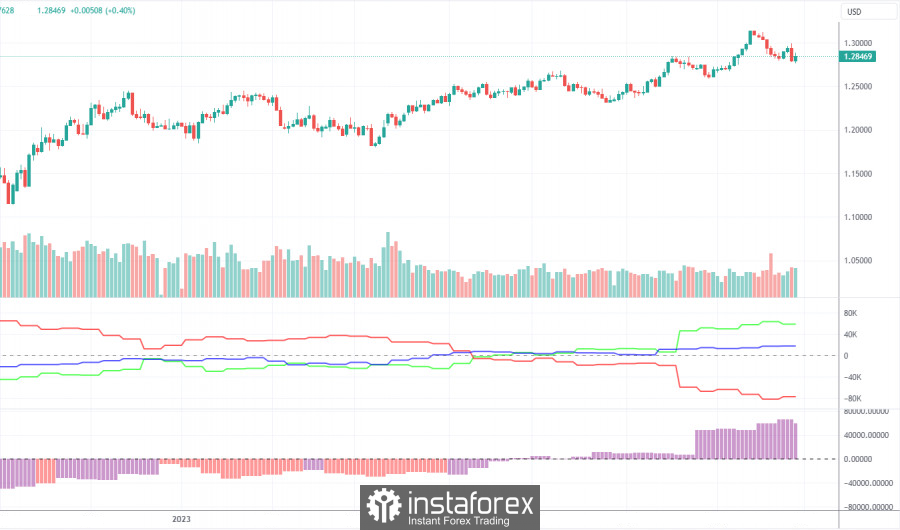
According to the latest report on the British pound, the "Non-commercial" group closed 29.8 thousand buy contracts and 25.0 thousand sell contracts. As a result, the net position of non-commercial traders decreased by 4.8 thousand contracts over the week, but it continues to grow overall. The net position has been consistently rising for the last ten months, as has the British pound. We are approaching a point where the net position has grown too much to expect further growth for the pair. An extended decline in the pound should commence. COT reports still allow for a slight strengthening of the British currency, but as each day passes, it becomes harder and harder to believe. The market's basis for continuing to buy is challenging to determine. Admittedly, there are currently only a few technical sell signals.
The British currency has risen a total of 2800 pips from its absolute lows reached last year, which is substantial. However, further growth would be more logical with a strong downward correction. Nevertheless, logic has long since vanished from the pair's movements. The market views the fundamental backdrop from a one-sided perspective, overlooking all data supporting the dollar. The "Non-commercial" group currently holds 105.5 thousand buy contracts and 46.5 thousand sell contracts. We remain skeptical about the long-term growth of the British currency, yet the market persists in buying, and the pair continues to rise.
Fundamental Event Analysis
There were a few significant macroeconomic events in the UK this week. Moderately neutral business activity indices in the service and manufacturing sectors declined compared to the previous month, but not as sharply as in the EU. The Federal Reserve held a meeting in the US, and the results can be interpreted in various ways. We believe that expecting a "hawkish" tone from Powell makes no sense, given the current interest rate of 5.5%. However, the market again interpreted Powell's statements as promising five more rate hikes, leading to the dollar's decline after the meeting. Over the week, the dollar also experienced a slight fall. Consequently, analyzing the fundamentals and macroeconomics offers little insight, as in most cases, the US currency continues to depreciate.
Trading plan for the week of July 31st to August 4th:
- The GBP/USD pair is facing difficulties establishing a new correction. Each new attempt to correct itself appears rather feeble. The price is above all the Ichimoku indicator lines (except for the critical one), which technically allows for considering long positions. If the price consolidates above the Kijun-sen line, it may indicate a potential resumption of the upward trend. The growth could be erratic, weak, inertial, or illogical. The target level is the Fibonacci level of 76.4% (1.3330).
- As for selling, there currently needs to be technical reasons to support such a stance. Although the price has consolidated below the Kijun-sen line, the quality of this consolidation is evident in the illustration above. Engaging in selling on such a strong upward trend is risky and unwise. On the other hand, purchasing without understanding the reasons behind the pound's rise and when its "rally" will end is also a dubious venture. The situation is atypical and overtly stagnant. It is advisable to trade the pair intraday or on lower timeframes.
Explanations for the Illustration:
Support and resistance levels, Fibonacci levels - these serve as the target levels when opening buy or sell positions. Take Profit levels can be set around them.
Indicators: Ichimoku (standard settings), Bollinger Bands (standard settings), MACD (5, 34, 5).
Indicator 1 on COT charts - indicates the net position size for each trader category.
Indicator 2 on COT charts - shows the net position size for the "Non-commercial" group.


