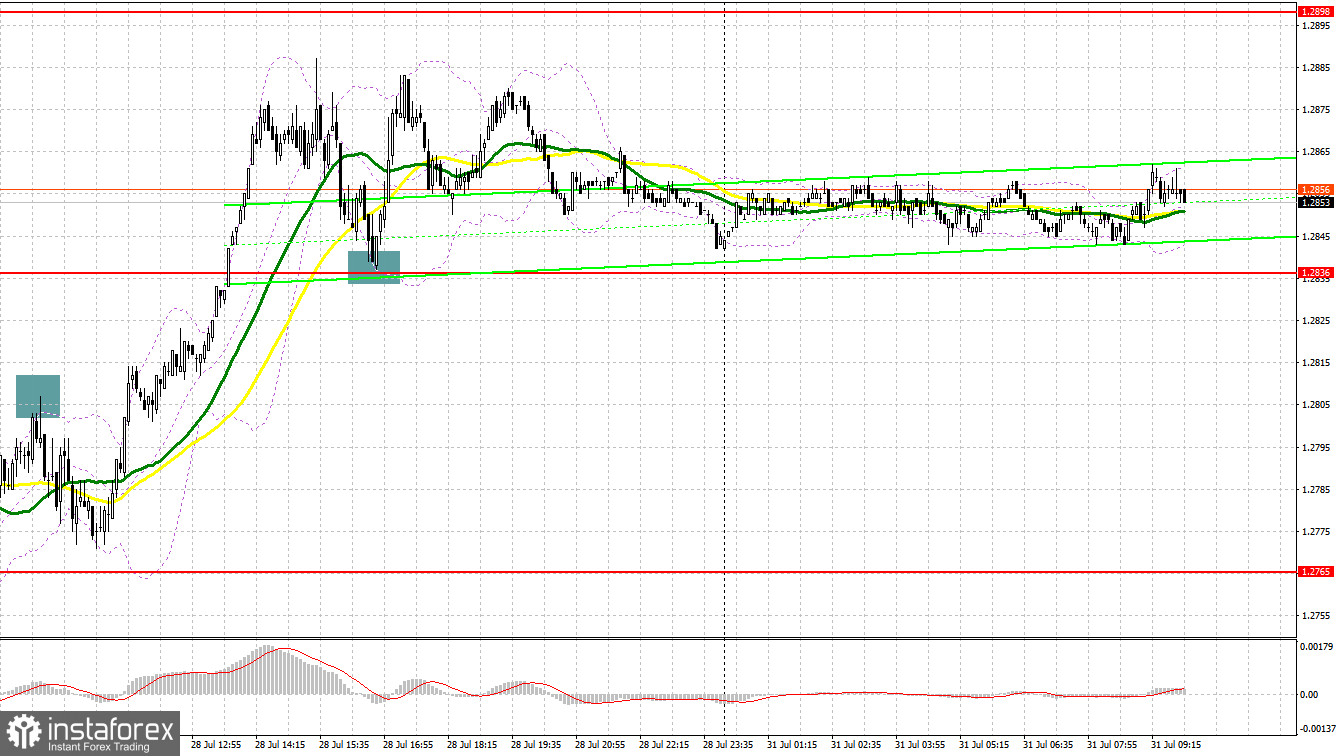
Last Friday, several signals for market entry were generated. Let's examine the 5-minute chart and analyze the events. In my morning forecast, I emphasized the significance of the level at 1.2807 and recommended making entry decisions based on it. The price movement and the formation of a false breakout at that level resulted in a signal to open short positions, leading to a decline of 30 points, but the intended target of 1.2761 was not reached. In the second half of the day, a significant upward surge followed, and a breakout with a reverse test of 1.2836 signaled a buy, leading to a rise of 40 points.

To open long positions on GBP/USD:
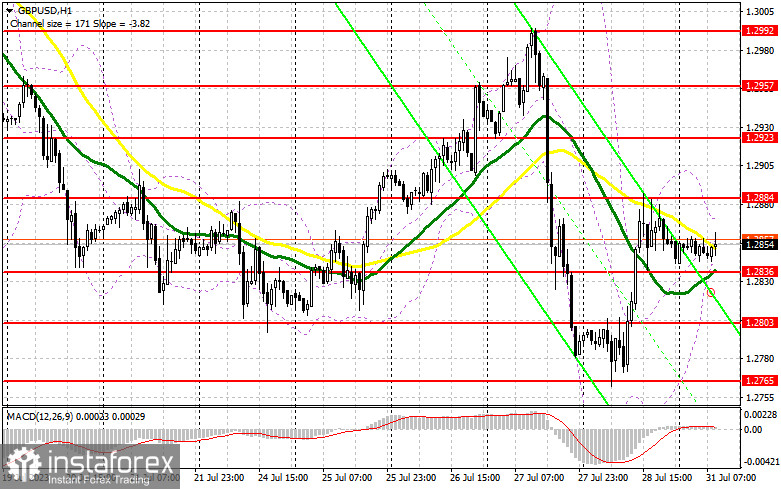
Today, the pound may continue its correction. Still, before considering long positions, it is essential to ensure that the data on changes in the M4 money supply aggregate, the number of approved mortgage applications, and the volume of net lending to individuals in the UK are not as negative as expected. The preferred buying scenario would involve a drop of the pound to the new support area at 1.2836, which was formed at the end of last Friday. Additionally, moving averages are favoring the bulls at this level. A false breakout below this level, particularly after weak reports on the UK, would provide an entry point for long positions, with the target of pushing GBP/USD upwards towards the nearest resistance at 1.2884. A successful breakout and consolidation above this range would lead to an upward correction following the recent decline, with an update to 1.2923 as the ultimate target. The resistance at 1.2957 would be a recommended profit-taking point.
With a decline to 1.2836 and a lack of buyers at that level, pressure on the pound will increase. In such a situation, a protective stance around the next area at 1.2803, combined with a false breakout at that level, would signal an opportunity to open long positions. Buying GBP/USD immediately on a rebound from last week's minimum at 1.2765 is also an option, aiming for a 30-35 point correction within the day.
To open short positions on GBP/USD:
The bears are currently controlling the market, but less actively than they did at the end of last week. A correction may continue because today is the last day of the month. Therefore, protecting the nearest resistance at 1.2884 is a priority for sellers. If the pair rises in the first half of the day due to positive lending data, a false breakout at this level would be an excellent signal to sell, with the aim of a decline towards the nearest support at 1.2836. A breakout and reverse test from below to above this range would deliver a more significant blow to buyer positions, providing a chance for a more substantial decline of GBP/USD towards 1.2803, where buyers would be active. The ultimate target remains last week's minimum at 1.2765, where taking profits would be recommended.


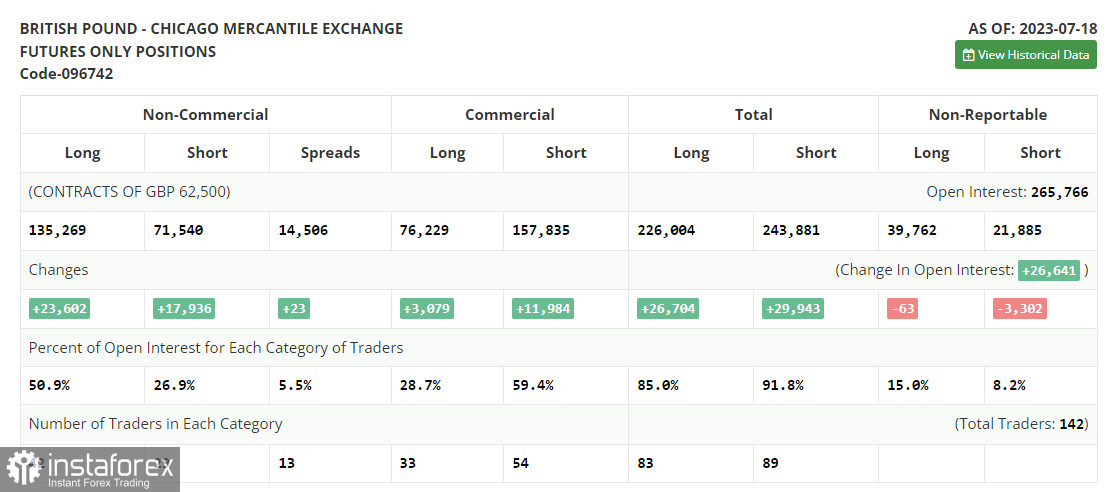
The COT report (Commitment of Traders) for July 18 indicated a significant increase in both long and short positions. Traders began returning to the market after fundamental statistics suggested a relatively stable state of the British economy, despite the gradual impact of high-interest rates. While the sharp decline in inflation in the US led to a rise in the pound, the pound's overbought condition, and the central bank's strict policies raised concerns about future labor and housing market issues in the UK. This allowed sellers to increase short positions whenever suitable, as evident from the COT report. Recent PMI reports also indicated rising problems. This week's Federal Reserve meeting may lead to a potential rise in the pound if the announcement signals the end of the interest rate hike cycle. The recommended strategy remains to buy the pound on price declines. According to the latest COT report, long non-commercial positions increased by 23,602 to 135,269, while short non-commercial positions rose by 17,936 to 71,540. This resulted in the non-commercial net position rising to 63,729 from 58,063 the previous week. The weekly closing price rose from 1.2932 to 1.3049.
Indicator signals:
Moving average
Trading occurs around the 30 and 50-day moving averages, indicating market uncertainty.
Note: The author considers the period and prices of the moving averages on the H1 hourly chart, which differ from the general definition of classical daily moving averages on the D1 daily chart.
Bollinger Bands
In the event of a decline, the lower boundary of the indicator, around 1.2836, will provide support.
Description of indicators:
• Moving average (determines the current trend by smoothing volatility and noise). Period 50. Marked in yellow on the chart.
• Moving average (determines the current trend by smoothing volatility and noise). Period 30. Marked in green on the chart.
• MACD indicator (Moving Average Convergence/Divergence) - Fast EMA period 12, Slow EMA period 26, SMA period 9.
• Bollinger Bands - Period 20.
• Non-commercial traders - speculators, such as individual traders, hedge funds, and large institutions, using the futures market for speculative purposes and meeting certain requirements.
• Long non-commercial positions represent the total long open positions of non-commercial traders.
• Short non-commercial positions represent the total short open positions of non-commercial traders.
• The overall non-commercial net position is the difference between non-commercial traders' short and long positions.


