Analysis of Monday trades:
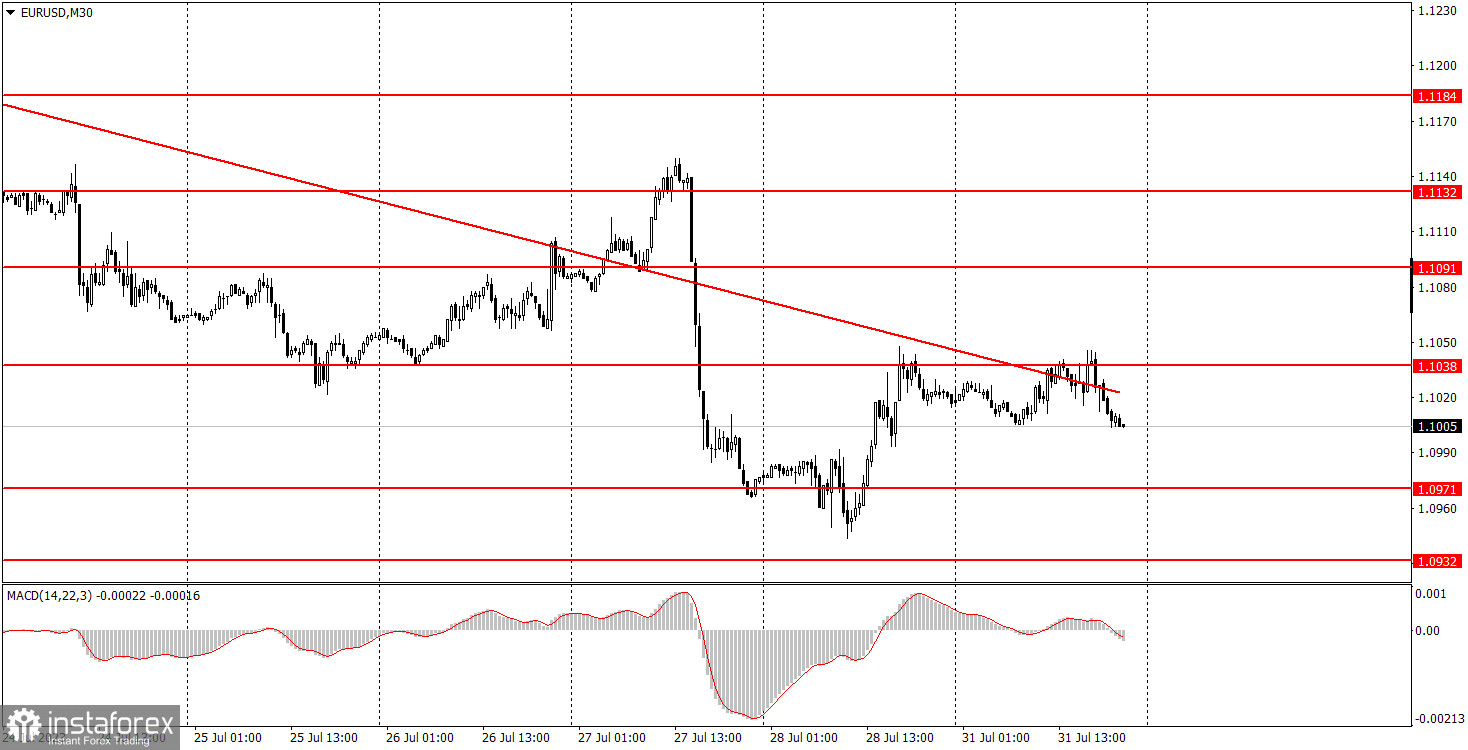
EUR/USD 30M chart

During the first trading day of the week, the EUR/USD currency pair barely moved. The pair traded sideways throughout the day, with a low volatility of only 41 pips. Amid that, there were few trading opportunities/ Predicting such minimal movement was a tough call, especially since two significant economic indicators were due to be released today: the EU GDP and inflation reports. However, despite their importance, both indicators aligned 90% with forecasted figures, leaving no room for market reactions as there were no unexpected deviations.
The preliminary estimate for the second quarter GDP showed a modest growth of 0.3%, while inflation marked a decrease from 5.5% to 5.3%. Analyzing this data, we can conclude that the European economy is barely growing or is stagnant. Inflation continues its downward trend and is still quite a distance away from the target. The European Central Bank has already started hinting towards potential winding down its monetary policy tightening phase. So, the current macroeconomic conditions are not providing any substantial support to the euro.
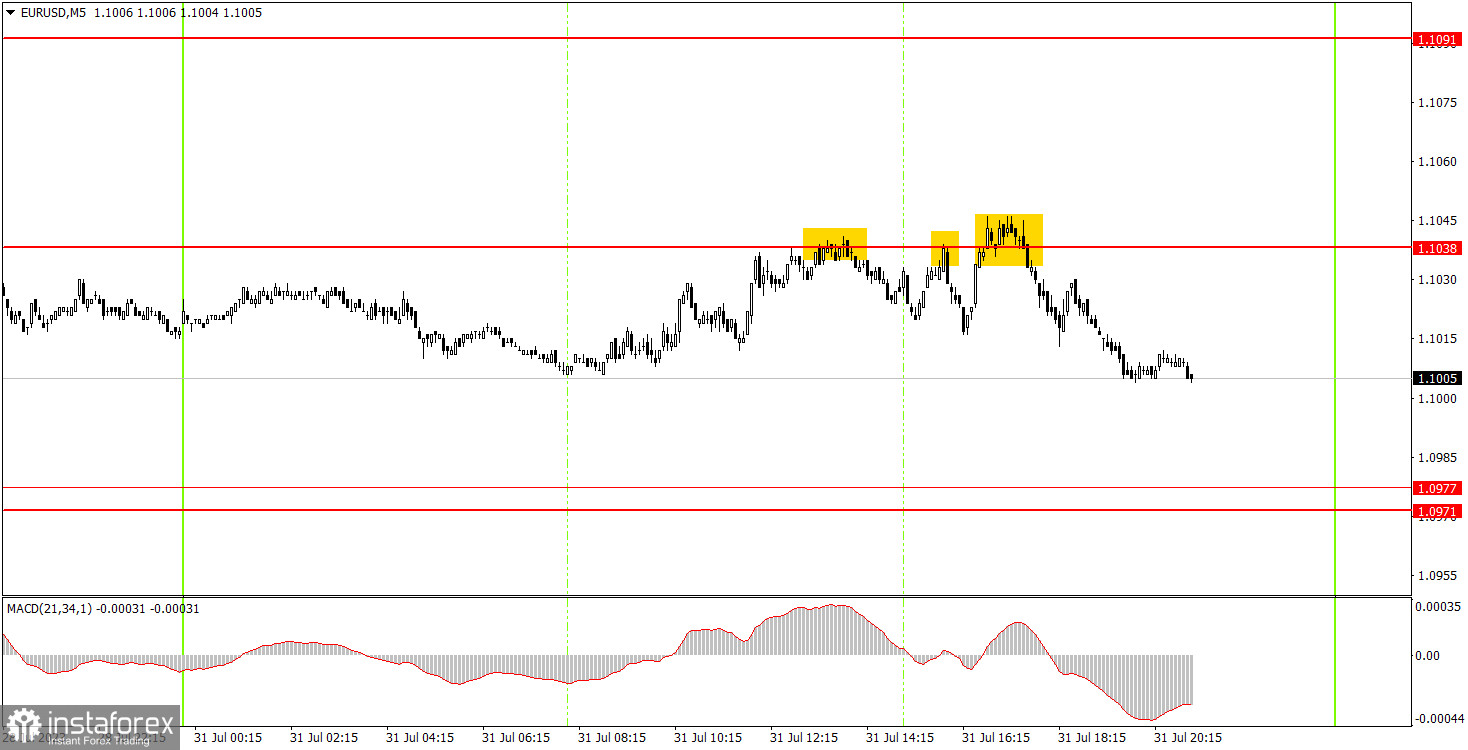
EUR/USD 5M chart

Three trading signals were formed today on the 5M timeframe. The price rebounded three times from 1.1038, but in the first two instances, it failed to even descend 15 pips. Therefore, only one sell trade should have been initiated. After the formation of the third signal, the pair managed to move about 20 pips in the correct direction, which could have been a potential profit for beginner traders. Considering the low-volatility flat market, this result is quite decent.
Trading strategy for Tuesday:
On the 30-minute timeframe, the pair resumed its downward trend, which was quite logical and justified. Currently, the euro is shedding its overbought status, and the market is losing faith in the ECB's continuous rate hike. On the 5-minute timeframe, the key levels to pay attention to are 1.0835, 1.0871, 1.0901, 1.0932, 1.0971-1.0977, 1.1038, 1.1091, 1.1132-1.1145, 1.1184, 1.1241, 1.1279-1.1292. If the price moves 15 pips in the right direction, you can set the Stop Loss to breakeven. In the European Union on Tuesday, the final estimate of the Manufacturing PMI for July and the unemployment rate will be published. We believe that there will be no market reaction to these reports. In the U.S., there will be two important reports: the ISM Manufacturing Index and the JOLTS job openings data. Both have the potential to spur a relatively strong market reaction.
The basic principles of the trading system:
1) The strength of the signal depends on the time period during which the signal was formed (a rebound or a break). The shorter this period, the stronger the signal.
2) If two or more trades were opened at some level following false signals, then any consequent signals near this level should be ignored.
3) During the flat trend, any currency pair may form a lot of false signals or do not produce any signals at all. In any case, the flat trend is not the best condition for trading.
4) Trades are opened in the time period between the beginning of the European session and until the middle of the American one when all deals should be closed manually.
5) We can pay attention to the MACD signals in the 30M time frame only if there is good volatility and a definite trend confirmed by a trend line or a trend channel.
6) If two key levels are too close to each other (about 5-15 pips), then this is a support or resistance area.
How to read charts:
Support and Resistance price levels can serve as targets when buying or selling. You can place Take Profit levels near them.
Red lines are channels or trend lines that display the current trend and show which direction is better to trade.
MACD indicator (14,22,3) is a histogram and a signal line showing when it is better to enter the market when they cross. This indicator is better to be used in combination with trend channels or trend lines.
Important speeches and reports that are always reflected in the economic calendars can greatly influence the movement of a currency pair. Therefore, during such events, it is recommended to trade as carefully as possible or exit the market in order to avoid a sharp price reversal against the previous movement.
Beginning traders should remember that every trade cannot be profitable. The development of a reliable strategy and money management are the key to success in trading over a long period of time.


