


Many economists believe that the Bank of England may raise the interest rate to 5.50% or even 6.00% if inflation remains high. Pound buyers can expect support from the Bank of England as long as the economy does not show clearer signs of slowing down and the BoE does not pause its interest rate hike cycle.
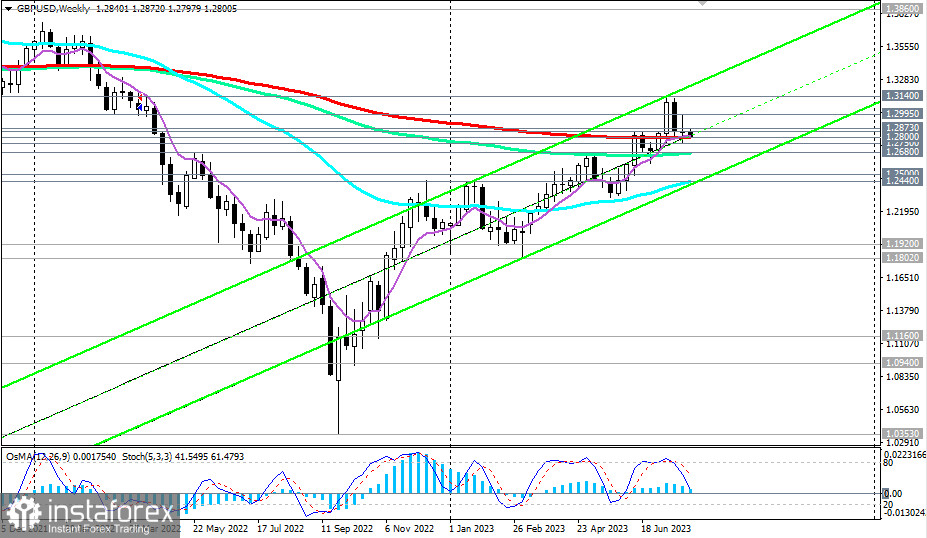
In the middle of last month, the GBP/USD pair reached a new high since May 2022 at 1.3142. However, it then started to decline due to the weakening pound and a strengthening dollar. As of writing, GBP/USD was trading near the 1.2800 level, which coincides with the key long-term support level (200 EMA on the weekly chart).
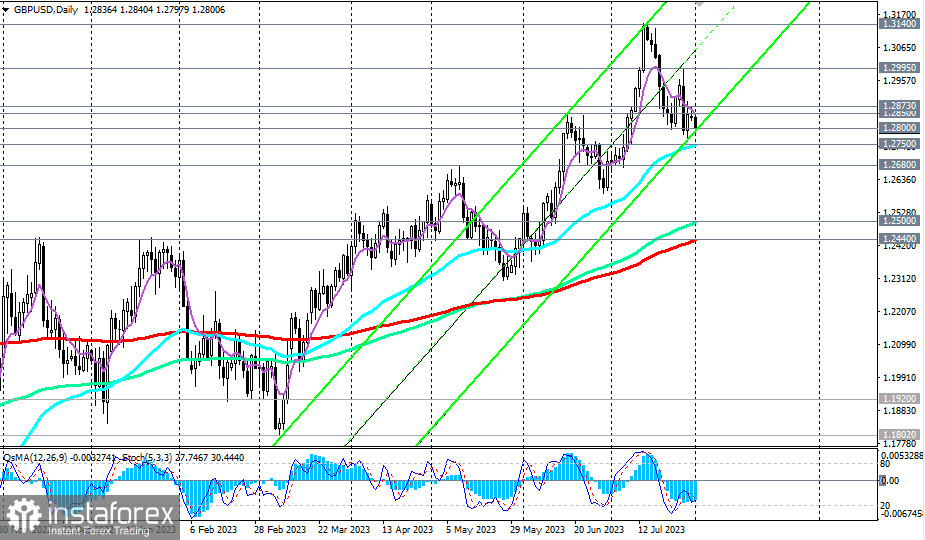
As the medium-term upward trend (above the key support levels of 1.2500 and 1.2440) is still intact, the current decline can still be considered corrective, up to the important support level of 1.2750 (50 EMA on the daily chart).
Therefore, pending buy orders near this support level are appropriate, but with stops placed below the important long-term support level of 1.2680 (144 EMA on the weekly chart), a break of which may signal a return to a long-term downward trend.
In this case, a break of the key medium-term support levels at 1.2500 (144 EMA on the daily chart) and 1.2440 (200 EMA on the daily chart) will confirm this return.
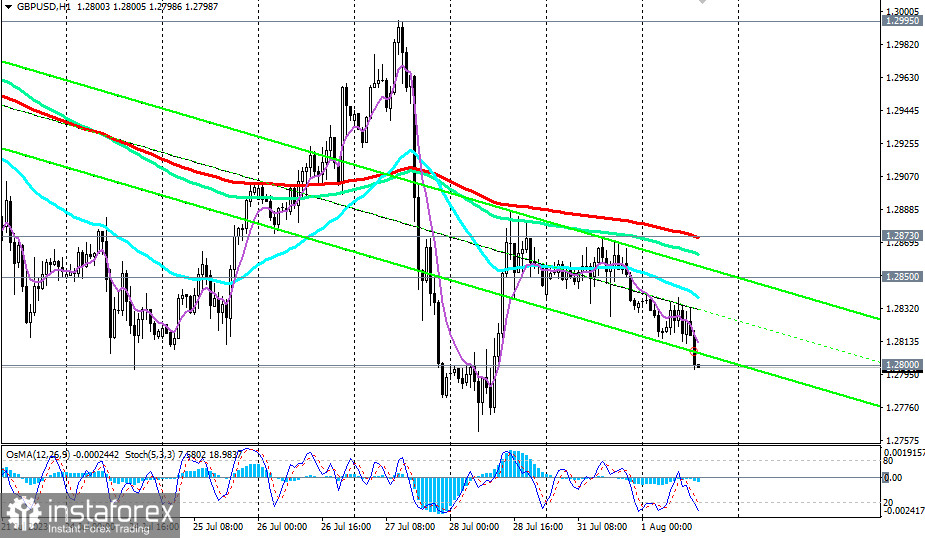
In an alternative scenario, a signal for buying will be a break above important short-term resistance levels at 1.2850 (144 EMA on the 4-hour chart) and 1.2873 (200 EMA on the 1-hour chart) with the nearest target at the local resistance level of 1.3000. Its break above will drive further GBP/USD growth within the upward channel on the weekly chart towards its upper boundary and levels of 1.3250 and 1.3300.
Further growth will lead the pair to key strategic resistance levels at 1.3860 and 1.4300 (200 EMA on the monthly chart). A break above these levels will, in turn, take the pair into the zone of a global bull market.
Support levels: 1.2800, 1.2750, 1.2700, 1.2680, 1.2600, 1.2500, 1.2440
Resistance levels: 1.2850, 1.2873, 1.2900, 1.3000, 1.3100, 1.3140, 1.3250, 1.3300, 1.3860, 1.3900, 1.4300


