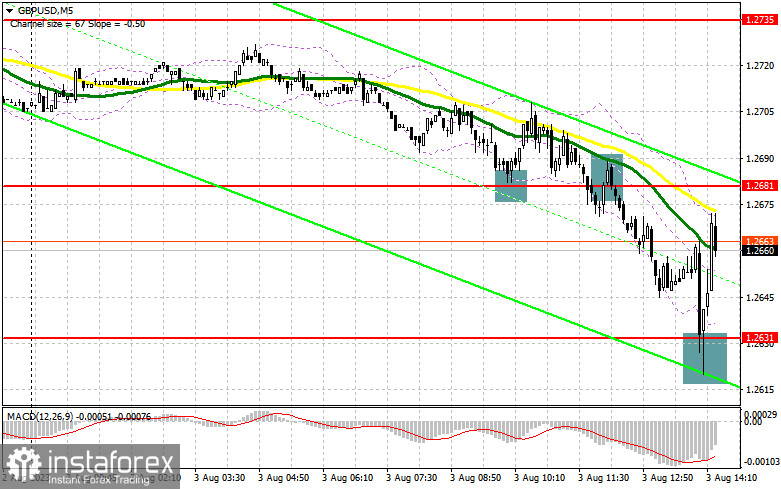
In my morning forecast, I highlighted 1.2681 as a crucial point for entry decisions. Let's examine the 5-minute chart to understand the recent market movements. The price action at 1.2681 indicated a buying opportunity for the pair, leading to an immediate increase of more than 25 points. On the other hand, a retest of 1.2681 with a break below resulted in a selling signal, causing a 50-point drop. Further purchases from 1.2631 allowed for an excellent entry point for buying, and the subsequent upward movement added approximately 40 points. The technical picture for the second half of the day remains unchanged.

For opening long positions on GBP/USD, the following conditions should be considered:
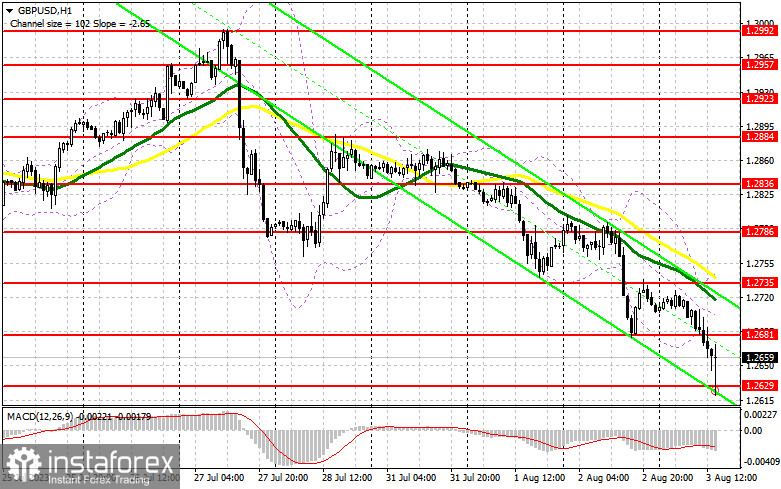
The Bank of England's recent interest rate hike of 0.25% has shifted the market's focus to Governor Andrew Bailey's press conference in the second half of the day. I recommend paying attention to the report on initial jobless claims and the ISM Non-Manufacturing PMI in the USA right after the press conference. Strong indicators paired with Bailey's dovish rhetoric may trigger a new pound sell-off. In such a scenario, I prefer to act against the trend only after a decline and a false break in the area of the new support at 1.2629, which formed during the European session. This would provide a buying signal for GBP/USD with a target of reaching the resistance at 1.2681. A breakthrough and a top-down test of this range will reinforce the buying signal, potentially driving the pound to 1.2735, where the moving averages supporting bearish sentiment are located. GBP/USD buyers may need to conquer this level to expect further growth. However, if there's an upward breakout beyond this range, we may see a surge towards 1.2786, at which point I would take profit.
In the event of a decline in GBP/USD and the absence of buyers at 1.2629 in the second half of the day, the bearish trend will likely continue, resulting in another test of the weekly low. In this scenario, I would postpone long positions until 1.2592, with purchases only considered on a false break. Alternatively, opening long positions on GBP/USD right after a rebound could be considered from 1.2557, aiming for a 30-35 pip intraday correction.
To open short positions on GBP/USD, the following conditions should be taken into account:
The bears have successfully continued the trend, and their primary target will be to defend the resistance at 1.2681, which acted as support in the morning. If US data indicates a sharp slowdown in activity and Governor Bailey remains convincing in his plans to combat high inflation, the pressure on the pound may ease, leading to a surge towards 1.2681. Whether the sellers can defend this range for the second time is debatable. As explained earlier, a false break at this level would signal selling opportunities, anticipating a decline toward support at 1.2629. A breakthrough and bottom-up test of this range would open the path towards 1.2592, ultimately targeting the minimum at 1.2557, where I would take profit.

In the scenario of an upward GBP/USD movement and the absence of bearish pressure at 1.2681 in the second half of the day, especially if there are hawkish statements from Bank of England representatives, buyers may gain the market initiative. In this case, only a false break in the area of the next resistance at 1.2735 would provide an entry point for short positions. If there's no significant activity, I suggest selling GBP/USD from 1.2786, expecting a 30-35 point bounce downward within the day.
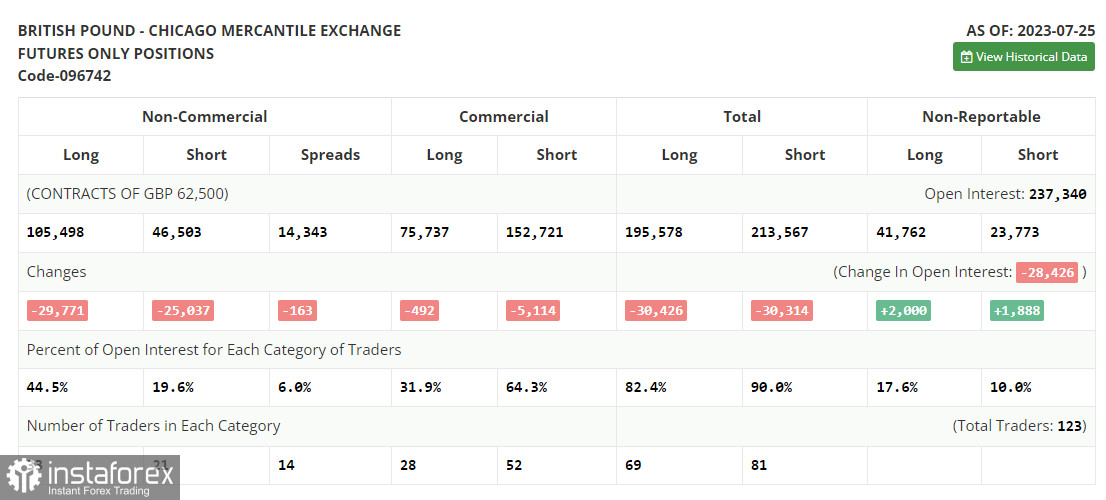
In the COT report (Commitment of Traders) for July 25, there was a reduction in both long and short positions. Traders were closing positions ahead of the important Federal Reserve System meeting, which left the market uncertain about the outcome. As a result, there were no significant changes in the market, as the regulator raised rates while leaving the possibility of another upward move open. However, it should be noted that this report still needs to reflect the new positions of players who returned to the market after the committee meeting. Strong data on the American economy likely shifted the balance in favor of pound sellers and US dollar buyers. Nevertheless, as before, the optimal strategy remains to buy the pound on declines, as the difference in central banks' policies will affect the prospects of the US dollar. The last COT report states that non-commercial long positions decreased by 28,771 to 105,498, while non-commercial short positions dropped by 25,037 to 46,503. As a result, the spread between long and short positions decreased by only 163. The weekly price declined to 1.2837 from 1.3049.

Indicator signals:
Moving Averages
Trading is taking place below the 30 and 50-day moving averages, indicating a further decline in the pair.
Note: The author considers the period and prices of the moving averages on the H1 hourly chart, which differ from the general definition of classical daily moving averages on the D1 daily chart.
Bollinger Bands
In the event of a decline, the lower boundary of the indicator, around 1.2680, will act as support.
Description of Indicators:
• Moving Average (a moving average that determines the current trend by smoothing volatility and noise). Period 50. Marked in yellow on the chart.
• Moving Average (a moving average that determines the current trend by smoothing volatility and noise). Period 30. Marked in green on the chart.
• MACD Indicator (Moving Average Convergence/Divergence - convergence/divergence of moving averages). Fast EMA period 12. Slow EMA period 26. SMA period 9.
• Bollinger Bands. Period 20.
• Non-commercial traders - speculators such as individual traders, hedge funds, and large institutions using the futures market for speculative purposes and subject to certain requirements.
• Long non-commercial positions represent the total long open positions of non-commercial traders.
• Short non-commercial positions represent the total short open position of non-commercial traders.
• The net non-commercial position is the difference between non-commercial traders' short and long positions.


