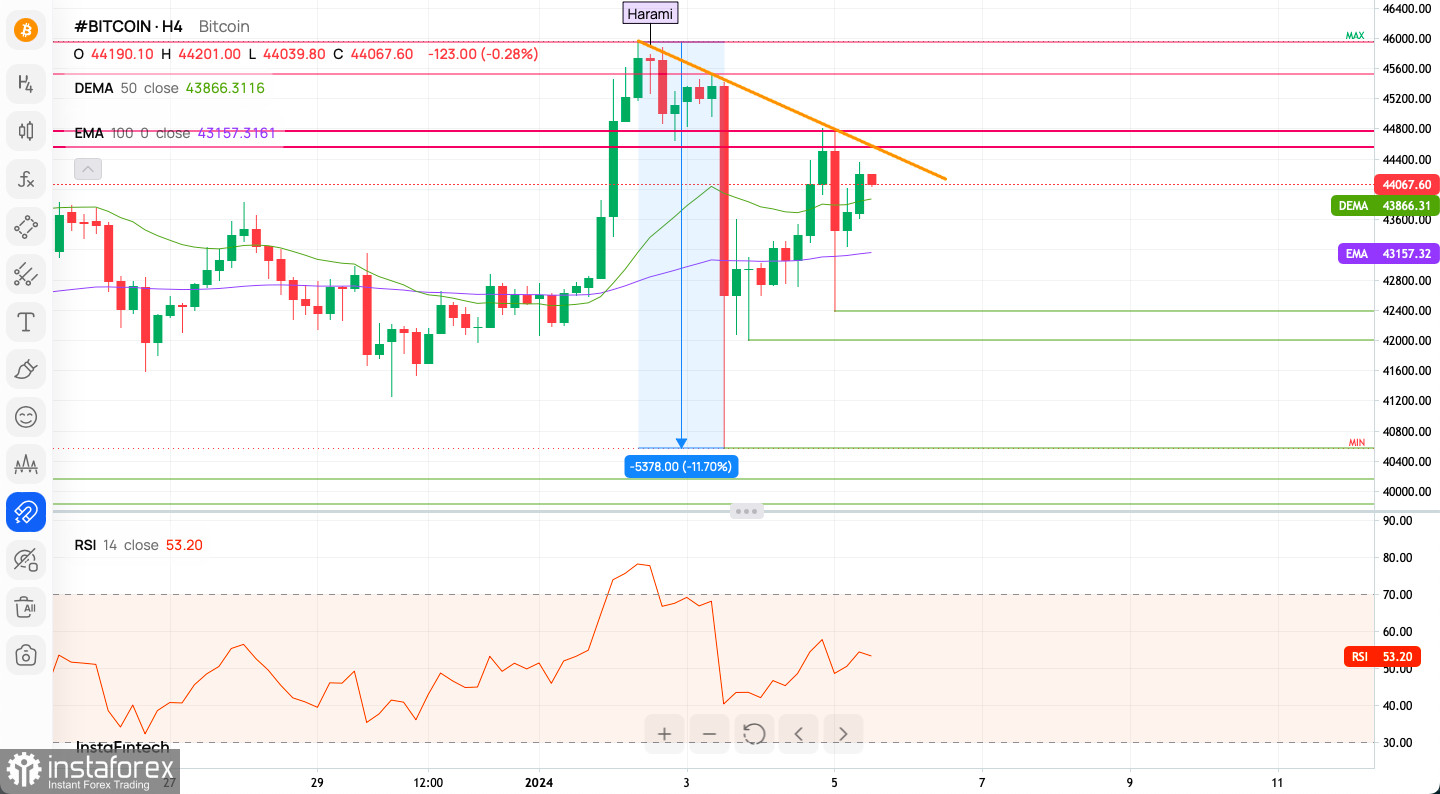
BTC/USD Analysis: Awaiting ETF Decision Impact
Essential Insights:
- Consolidation Before ETF News: BTC/USD is in a holding pattern pending the SEC's decision on Bitcoin ETFs.
- Indicators Suggest Bullish Trend: Most technical indicators and moving averages signal a bullish trend for Bitcoin.
- Critical Levels to Monitor: Watch for key support and resistance levels for potential trend shifts.
Global Crypto Market Context
The cryptocurrency world is abuzz with the possibility of the SEC approving Bitcoin ETFs. If confirmed, this could significantly impact the market, although an immediate rate jump is not guaranteed. The approval is excellent news for long-term investors, but short-term corrections are possible.

Technical Analysis: Current Market Status
The BTC/USD pair remains in a consolidation channel pending final news on SEC approval of ETFs today. In both cases, we may witness greater volatility in the stock. Nevertheless, for now the volatility has decreased and the BTC/USD pair has been seen trading between the levels of $43,241 - $44,804. The recent rejection of the trend line resistance might indicate a stronger bearish pressure comming to markets soon. The key short-term technical support is seen at $40,508 (spike down low from yesterday).
Indicator Insights
- Intraday 1H Signals: A majority of technical indicators (16 out of 21) show a Buy signal, with 18 out of 18 moving averages also favoring Buy.
- Sentiment Scoreboard: Overall market sentiment is bullish, with a strong majority supporting a bullish trend in the past week and recent days.
Weekly Pivot Points
- Key Levels: Resistance at WR3 ($51,335) and support at WS3 ($38,079).
- Market Positioning: These levels can offer insights into potential market reactions and trend reversals.

Long-Term Trading Perspective
- Moving Averages: Bitcoin's price above both 55 and 100-week ADMAs indicates a strong medium to long-term bullish trend.
- Elliot Wave Theory: The current price movement suggests we are in a bullish wave 3, potentially indicating continued upward momentum.
- Fibonacci Levels: The next projected target based on Fibonacci levels is around $50,450.
Conclusion: Navigating Bitcoin's Future
For bullish traders, maintaining positions above key support levels seems aligned with the longer-term uptrend. Conversely, bearish traders should watch for breaks below these levels for potential entry points. The SEC's decision on Bitcoin ETFs could significantly impact market dynamics, so traders should stay informed and adapt strategies accordingly.
Useful Links
Important Notice
The begginers in forex trading need to be very careful when making decisions about entering the market. Before the release of important reports, it is best to stay out of the market to avoid being caught in sharp market fluctuations due to increased volatility. If you decide to trade during the news release, then always place stop orders to minimize losses.
Without placing stop orders, you can very quickly lose your entire deposit, especially if you do not use money management and trade large volumes. For successful trading, you need to have a clear trading plan and stay focues and disciplined. Spontaneous trading decision based on the current market situation is an inherently losing strategy for a scalper or daytrader.


