GBP/USD Dynamics: A Balanced Forex Perspective
Understanding Current Trends and Market Signals
The GBP/USD pair, often a focal point in forex trading, presents a nuanced picture as of January 8, 2024. Technical analysis reveals a complex interplay of indicators and market sentiment, crucial for traders to understand.

Key Takeaways
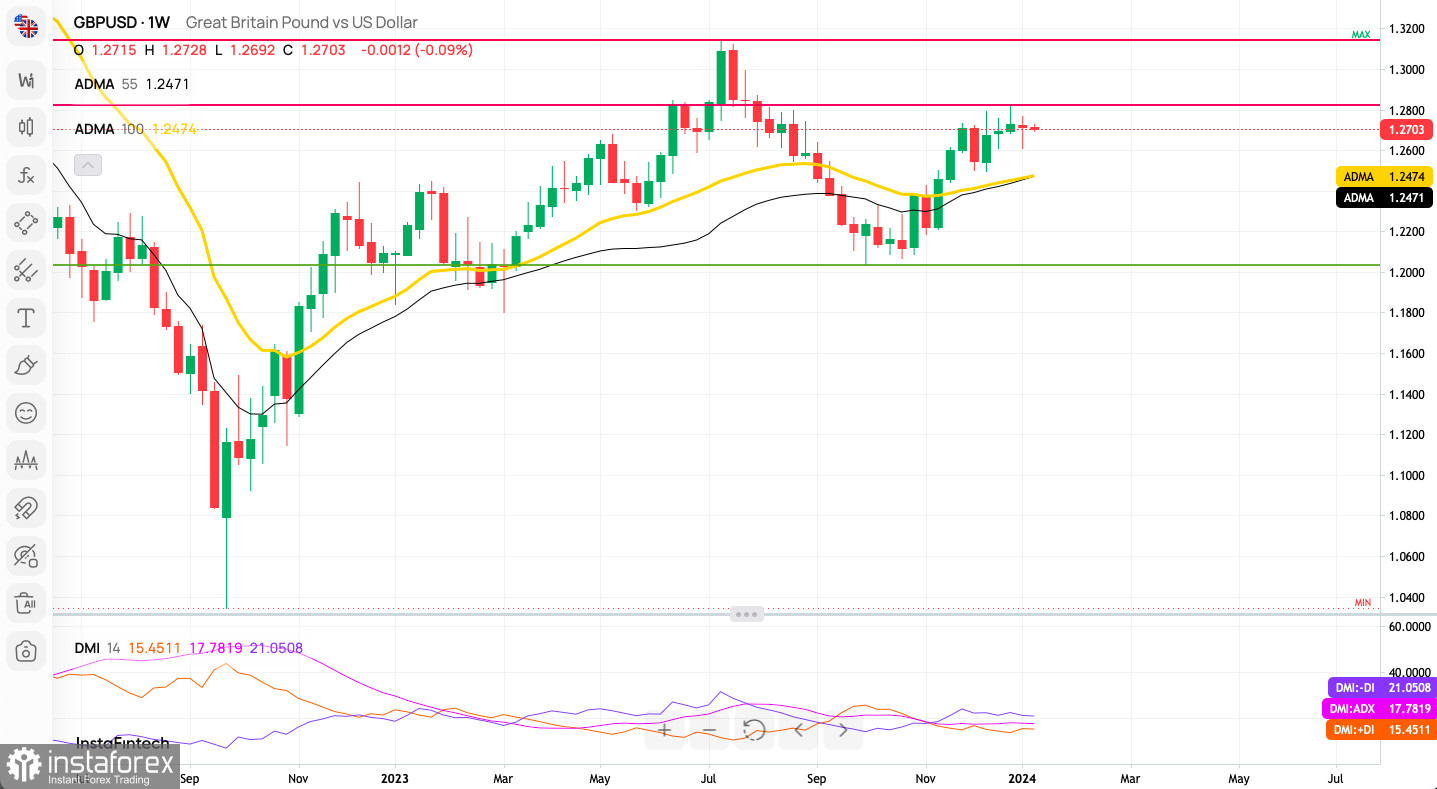
- Moving Averages as Momentum Indicators: The interaction between the price and the 55 and 100-week ADMAs is vital for gauging market momentum.
- Potential for Major Breakout: Current price consolidation hints at a significant breakout, necessitating vigilant market monitoring.
- Assessing Trend Strength: The ADX reading suggests a weak trend. A rise above 25 could signal increasing momentum, critical for long-term strategy.
Technical Analysis: A Closer Look
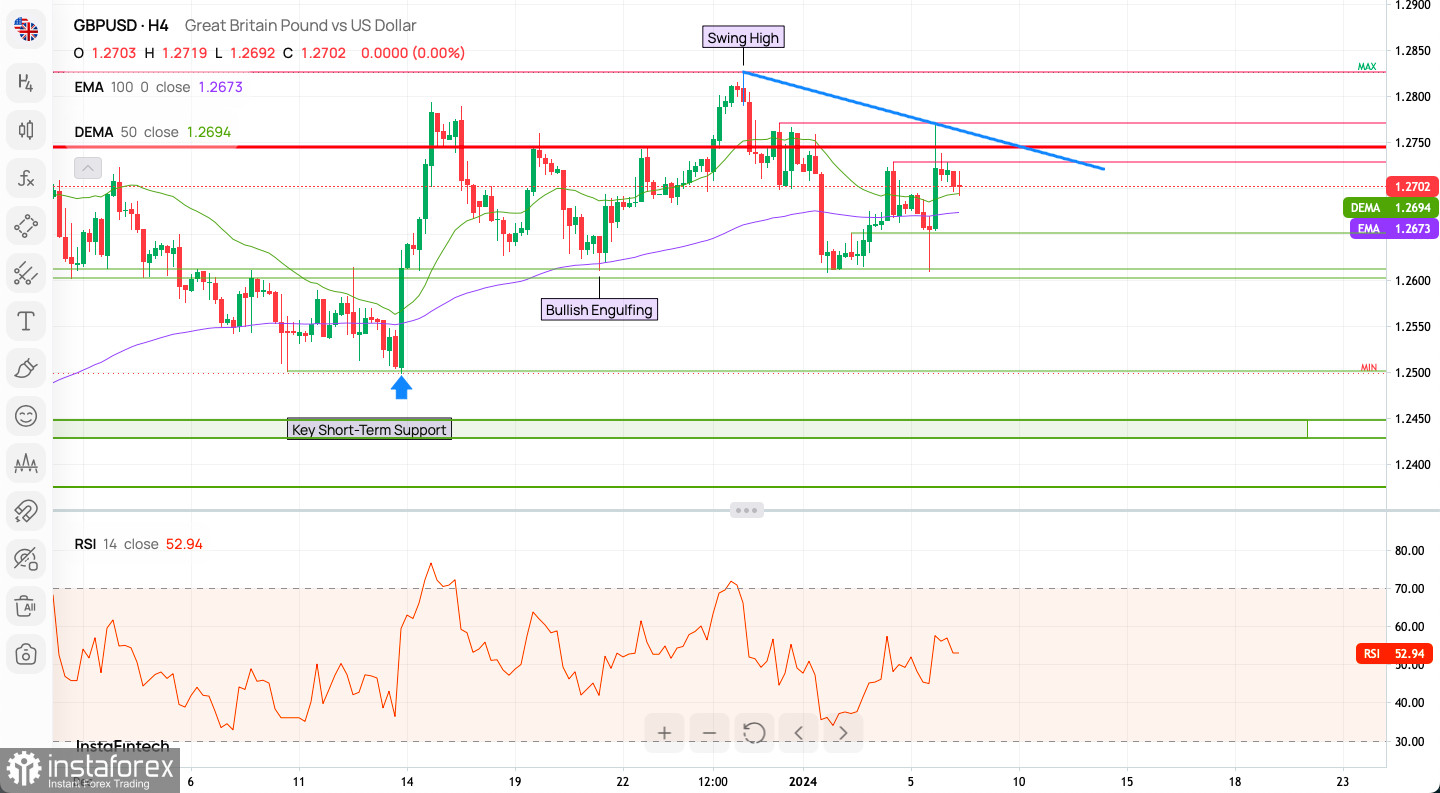
The GBP/USD pair's movement shows a reversal at 1.2769, descending towards the mid-range. Notable intraday support is found at 1.2651 and 1.2608, with resistance at 1.2727 and 1.2745. The H4 chart indicates neutral momentum, with neither bulls nor bears in clear control.

Indicator Insights:
- Bullish Engulfing Pattern: Suggests possible upward trend initiation or downtrend reversal.
- Key Short-Term Support: A critical juncture; holding above could boost bullish prospects, while breaking below may signal bearish momentum.
- Swing High: Surpassing this peak may indicate an ongoing uptrend.
- Moving Averages: The 100-period EMA and 50-period DEMA act as dynamic resistance levels.
- RSI Indicator: At 52.94, indicating slight bullish momentum.
The bullish engulfing pattern and RSI positioning point to a potential upward movement. However, resistance from moving averages could hinder this ascent.
Intraday Indicators and Sentiment
- Sell vs. Buy Signals: 11 out of 21 indicators suggest Sell, 6 are Neutral, and 4 indicate Buy.
- Moving Averages: 15 signal Buy, while 3 suggest Sell.
- Market Sentiment: Predominantly bullish (58%), but recent trends show a shift towards bearish sentiment (58% bears).
Weekly Pivot Points
- Highs: WR3 - 1.30140, WR2 - 1.28537, WR1 - 1.27767
- Pivot: 1.26934
- Lows: WS1 - 1.26164, WS2 - 1.25331, WS3 - 1.23728
Long-Term Outlook
On the weekly chart, a Bullish Engulfing pattern post-breakout at 1.2340 suggests bullish dominance, with the market trading above the 50 WMA and 100 WMA. The next target for bulls is the 2023 high at 1.3141. A drop below 1.1802 could herald a significant bearish trend, potentially aiming for 1.1494.

Conclusion: Trading Perspectives for Bulls and Bears
Bullish Scenario: Overcoming key resistance levels and moving averages could affirm an upward trend.
Bearish Scenario: A fall below support levels might indicate a developing downtrend. In forex trading, a balanced approach, combining technical analysis with ongoing market observation, is paramount for strategic decision-making.
Useful Links
Important Notice
The begginers in forex trading need to be very careful when making decisions about entering the market. Before the release of important reports, it is best to stay out of the market to avoid being caught in sharp market fluctuations due to increased volatility. If you decide to trade during the news release, then always place stop orders to minimize losses.
Without placing stop orders, you can very quickly lose your entire deposit, especially if you do not use money management and trade large volumes. For successful trading, you need to have a clear trading plan and stay focues and disciplined. Spontaneous trading decision based on the current market situation is an inherently losing strategy for a scalper or daytrader.


