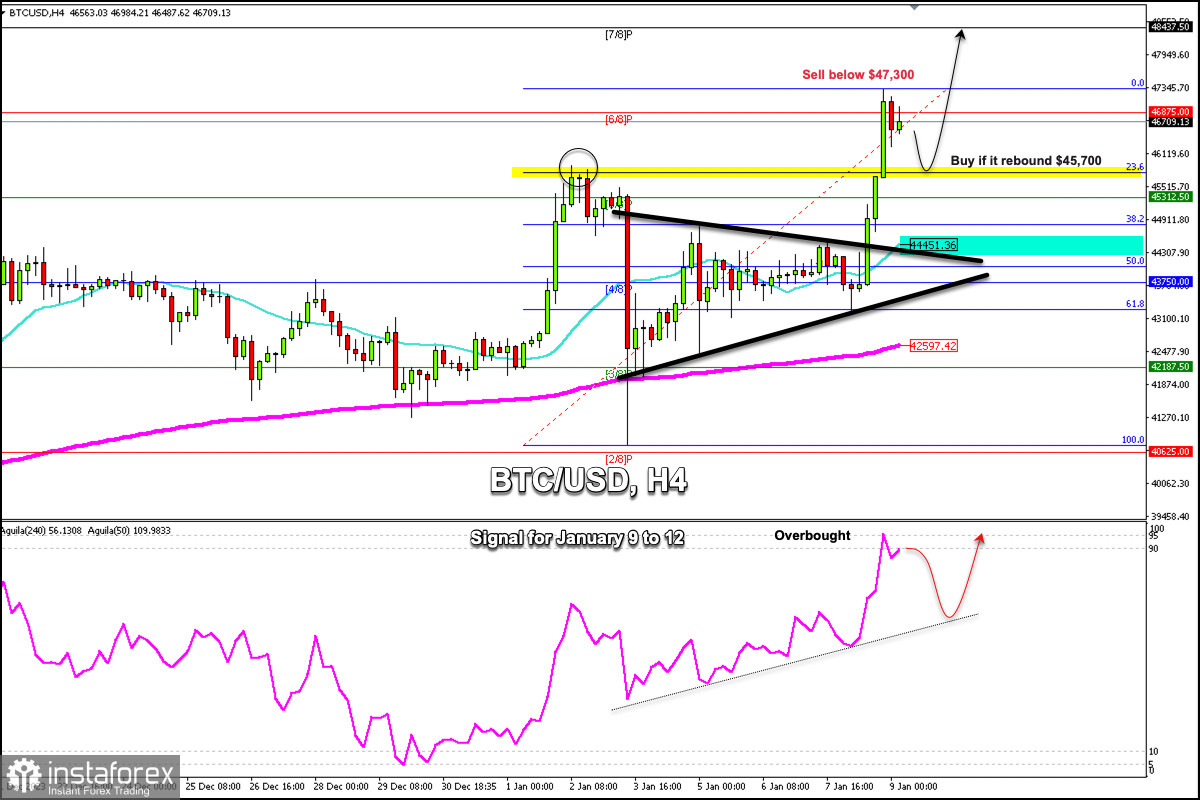
Early in the Asian session, we can observe that Bitcoin is trading around $46,756, below 6/8 Murray which represents a strong resistance, and above the 21 SMA located at $44,451.
In the last few hours, we observed on the chart that Bitcoin broke sharply the symmetrical triangle pattern formed since early January. BTC rose rapidly after consolidating above the 21 SMA and breaking the technical pattern and thus reached its high of this year for now around 47,299.52.
Before opening today, Bitcoin was trading at about 43,270. In less than 24 hours, it reached the 47,000 level, this area was last seen in May 2022. Therefore, Bitcoin gained more than 6.83%.
The optimistic catalyst for the strong demand for Bitcoin is good progress towards a BTC spot ETF market. This is generating strong optimism among crypto investors. So, if this trend continues in the coming days, the token could reach 7/8 Murray located at 48,437 and even the psychological level of $50,000.
On the other hand, technically, the eagle indicator has approached an extremely overbought zone. If Bitcoin trades below 6/8 Murray or below its high of 47,300, we could expect a technical correction towards the 23.6% Fibonacci retracement located at $45,600.
If a technical correction scenario occurs, it could favor the bulls and Bitcoin could gain momentum and could reach new highs and even exceed the psychological $50,000 level.
As long as the Bitcoin trades above the 200 EMA (42,597) and above the 21 SMA (45,700), the outlook will remain positive for the Bitcoin and any pullback towards these areas could be seen as an opportunity to resume buying.
In case Bitcoin falls around the 50% Fibonacci retracement, the level that coincides with the 21 SMA and also with the symmetrical triangle pattern that was broken, it could provide a strong technical bounce around this area and we could consider buying.


