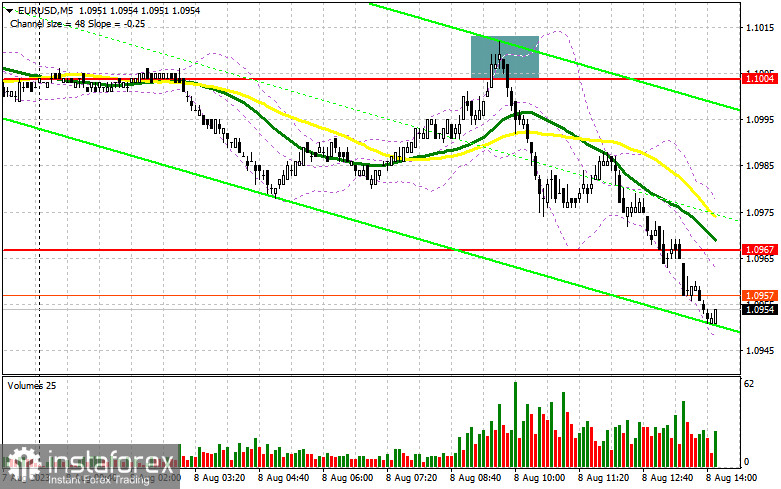
In my morning forecast, I drew attention to the 1.1004 level and recommended using it to make market entry decisions. Let's look at the 5-minute chart and see what happened there. The rise and formation of a false breakout at 1.1004 provided a good selling signal for the euro, which resulted in a drop of more than 40 points. The technical picture was reassessed for the afternoon.

To open long positions on EUR/USD, it requires:
It's evident that the German inflation data failed to support the euro, and after an unsuccessful growth attempt, which allowed for the selling signal, pressure on the pair resumed. In the second half of the day, all eyes will be on the speeches from the Federal Reserve representatives, namely Patrick T. Harker and Thomas Barkin. Additionally, the NFIB small business optimism index and the trade balance might cause a slight spike in volatility, but this is unlikely. For this reason, I expect the pressure on EUR/USD to continue.
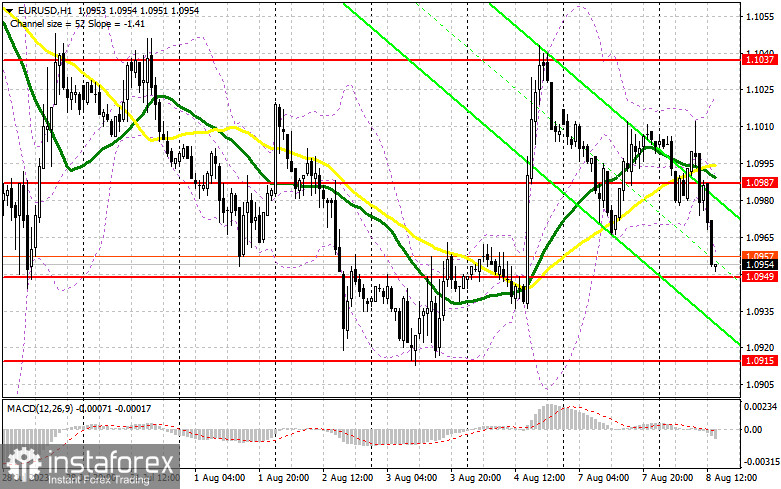
Yes, buyers might assert themselves and, like yesterday, recover the entire decline, but for this to happen, they need to protect the immediate support level at 1.0949. The formation of a false breakout there will give a buying signal with the expectation of an upward movement aiming to refresh the new resistance at 1.0987, formed during the first half of the day. A breakout and a top-down test of this range, against the backdrop of dovish statements from the Fed representatives, will bring back demand for the euro, aiming for a return to the peak of 1.1037. The ultimate target remains the 1.1072 area, where I will take profits. If EUR/USD declines and there's no activity at 1.0949 in the second half of the day, problems for euro buyers will increase since this would mean a complete reversal of Friday's rise. In this case, only the formation of a false breakout around the next support level of 1.0915 will provide a buying signal for the euro. I will immediately open long positions on a rebound from the 1.0871 minimum, targeting an upward correction of 30-35 points within the day.
To open short positions on EURUSD, it requires:
Sellers today still have chances to maintain the intraday bearish market, and as long as trading remains below the 1.0987 mark, the advantage will be on their side. In the event of a rise in EUR/USD after the publication of the Federal Reserve representatives' interviews and weak trade balance data, I plan to open short positions only after forming a false breakout around 1.0987. This will lead to a sell signal and a decline to the new support area of 1.0949, where trading is underway. Only after a breakout and consolidation below this range and a bottom-up retest can a sell signal emerge, opening a direct path to 1.0915 and 1.0871, indicating the establishment of a bearish trend. The ultimate target will be the 1.0836 zone, where I will be taking profits. In the event of an upward movement of EUR/USD during the American session and the absence of bears at 1.0987, which cannot be ruled out, the bulls will try to reclaim their advantage, leading to an upward correction. Under such developments, I'll delay short positions until the 1.1037 resistance. I can also sell there but only after an unsuccessful consolidation. I will open short positions immediately on a rebound from the peak of 1.1072 with a target of a downward correction of 30-35 points.
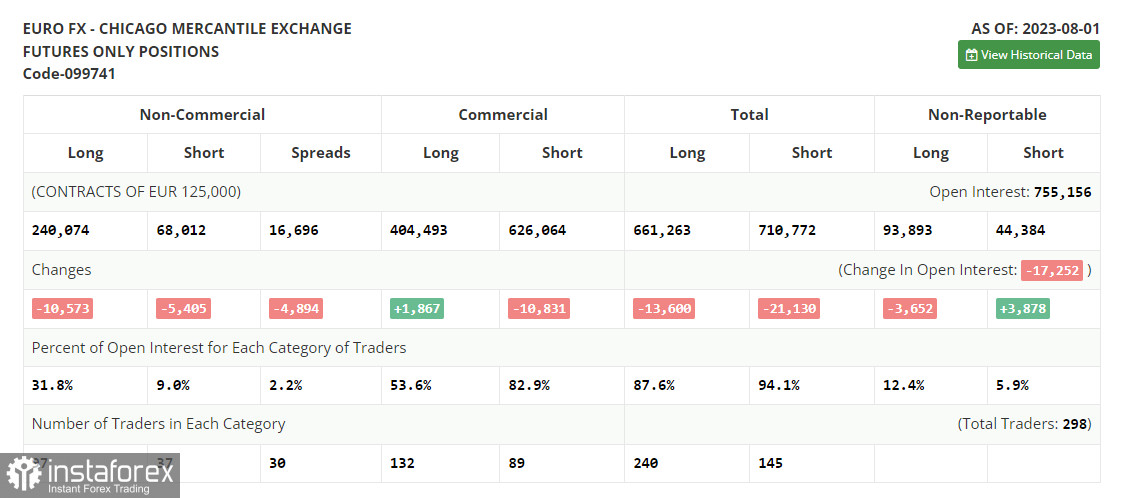
In the COT (Commitment of Traders) report for August 1st, a decrease in both long and short positions was observed. This occurred after the Federal Reserve and the European Central Bank meetings, and now traders are focused on new statistics, which will allow them to understand the regulators' plans better. A U.S. inflation report will be released soon, which will clarify things. A further decrease in price pressure will likely allow the Fed to take a break in September, while its increase will fuel even more talks about the need for further policy tightening, which will favor the dollar. However, despite the downward correction, the optimal medium-term strategy under current conditions remains buying euros on declines. The COT report shows that long non-commercial positions decreased by 10,573 to 240,074, while short non-commercial positions dropped by 5,405 to 68,012. As a result, the spread between long and short positions narrowed by 4,894, favoring euro sellers. The closing price decreased to 1.0999 from 1.1075 a week earlier.
Edit
Indicator signals:
Moving Averages:
Trading is below the 30 and 50-day moving averages, indicating the likelihood of a bearish market resumption.
Note: The author considers the period and prices of moving averages on the hourly chart H1 and differ from the general definition of classic daily moving averages on the daily chart D1.
Bollinger Bands:
In case of an upward trend, the upper boundary of the indicator at 1.1025 will act as resistance.
Description of indicators:
• Moving average (determines the current trend by smoothing out volatility and noise). Period 50. Marked in yellow on the chart.
• Moving average (determines the current trend by smoothing out volatility and noise). Period 30. Marked in green on the chart.
• MACD Indicator (Moving Average Convergence/Divergence). Fast EMA period 12. Slow EMA period 26. SMA period 9.
• Bollinger Bands. Period 20.
• Non-commercial traders - speculators such as individual traders, hedge funds, and large institutions that use the futures market for speculative purposes and meet specific requirements.
• Long non-commercial positions represent the total long open position of non-commercial traders.
• Short non-commercial positions represent the total short open position of non-commercial traders.
• The total non-commercial net position is the difference between non-commercial traders' short and long positions.


