GBP/USD Shows Bullish Signals Amid Resistance
Key Takeaways
- The GBP/USD pair exhibits potential for an uptrend with a bullish engulfing pattern.
- Price sustains above key moving averages, indicating buyer dominance.
- Resistance ahead poses a crucial test for continued bullish momentum.
Price Action and Indicators
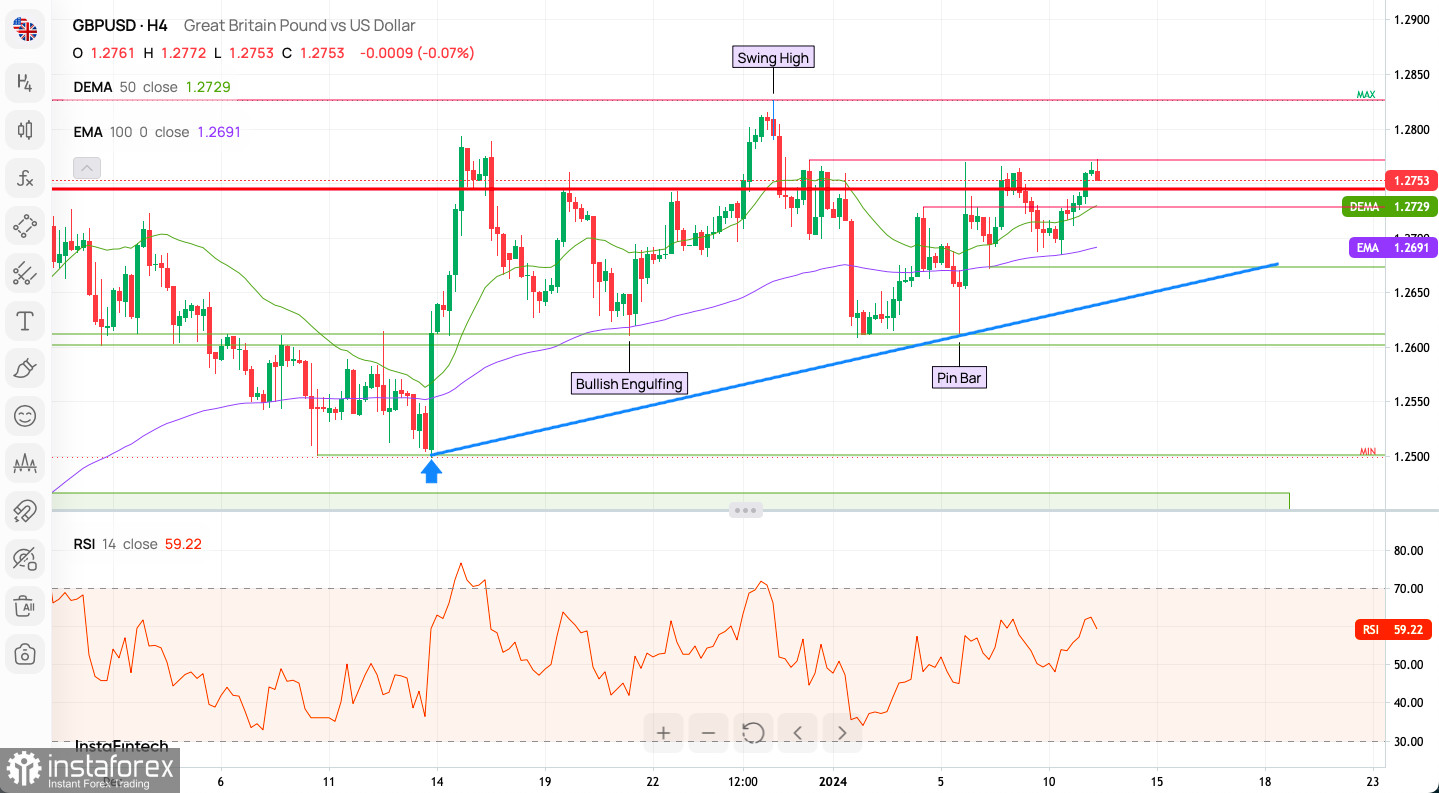
The GBP/USD 4-hour chart reveals a bullish scenario as the price action forms a bullish engulfing pattern. This pattern, occurring when a larger candlestick fully engulfs the smaller preceding one, typically signals a shift in momentum favoring buyers. The currency pair stands above both the 50-period Double Exponential Moving Average (DEMA) and the 100-period Exponential Moving Average (EMA), suggesting a strong upward trend.

Monitoring Momentum: RSI Analysis
The Relative Strength Index (RSI), a momentum oscillator, measures at 59.22. This value is noteworthy as it resides below the overbought threshold of 70, hinting that there may be more room for price growth before the market reaches an overextended state.
Understanding Support and Resistance
On the chart, the Cable approaches a significant resistance level. This level previously acted as a barrier, and its role in the current context remains pivotal. If the price manages to break and hold above, it could solidify the uptrend. Meanwhile, the ascending blue trendline below the price suggests a reliable support zone, reinforcing the bullish outlook.
Concluding Insights for Traders
For traders with a bullish perspective, a sustained break above the current resistance level could be seen as an opportunity for further gains. On the other hand, those with a bearish outlook may seek signs of price rejection at this resistance for a potential downturn. It is essential to consider the broader market context and incorporate risk management strategies in any trading plan.
Remember, this summary is not a directive but an analytical perspective based on chart patterns and technical indicators. Always consider the full spectrum of market factors and your own risk tolerance before engaging in the forex market.

GBP/USD H1 Intraday Indicator Signals:
- 10 out of 21 technical indicators are showing Buy signal, 9 indicators are Neutral and 3 are showing Sell signal
- 16 out of 18 moving averages are showing Buy signal and 2 are showing Sell signal
Sentiment Scoreboard:
The general sentiment on the scoreboard is bullish (59% vs.41% bears). Last week sentiment remains bullish as well (58% bulls vs.42% bears) while the last three days sentiment is shifted to bullish again (56% bulls vs.44% bears).
Weekly Pivot Points:
WR3 - 1.30140
WR2 - 1.28537
WR1 - 1.27767
Weekly Pivot - 1.26934
WS1 - 1.26164
WS2 - 1.25331
WS3 - 1.23728
Weekly Time Frame Trading Outlook:
The weekly time frame chart reveals a decisive Bullish Engulfing candlestick pattern materializing amid the breakout beyond the 1.2340 level, signaling the dominance of bullish sentiment as prices continue to climb. Currently, the market is trading above the 50 WMA and 100 WMA, so the next target for the bulls is the 2023 swing high located at 1.3141. Conversely, a sustained breakout below the critical long-term technical support at 1.1802 significantly heightens the probability of a substantial downward movement, potentially targeting the level of 1.1494.
Useful Links
Important Notice
The begginers in forex trading need to be very careful when making decisions about entering the market. Before the release of important reports, it is best to stay out of the market to avoid being caught in sharp market fluctuations due to increased volatility. If you decide to trade during the news release, then always place stop orders to minimize losses.
Without placing stop orders, you can very quickly lose your entire deposit, especially if you do not use money management and trade large volumes. For successful trading, you need to have a clear trading plan and stay focues and disciplined. Spontaneous trading decision based on the current market situation is an inherently losing strategy for a scalper or daytrader.


